Fig. 10.
Download original image
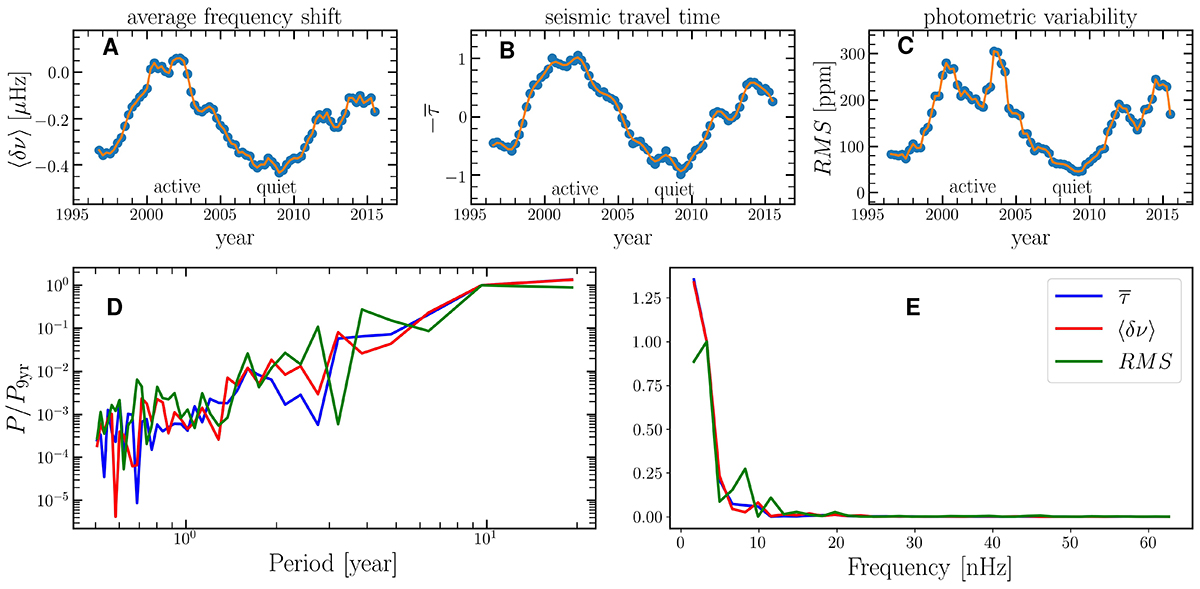
Solar cycle variations in the seismic average mode frequency shift from Howe et al. (2017) (A), the seismic average travel time (B) and photometric variability (C). The orange curve connects the data points. The data analyzed here was divided into overlapping time segments of T = 1 yr in length and mid-points separated by Δt = 91.25 d. (D, E) Power spectra of the activity observables shown in panels A–C. All power spectra are normalized to the power at frequency 1/(9 yr). The abscissa shows the period in the left panel and the frequency in the right panel.
Current usage metrics show cumulative count of Article Views (full-text article views including HTML views, PDF and ePub downloads, according to the available data) and Abstracts Views on Vision4Press platform.
Data correspond to usage on the plateform after 2015. The current usage metrics is available 48-96 hours after online publication and is updated daily on week days.
Initial download of the metrics may take a while.