Open Access
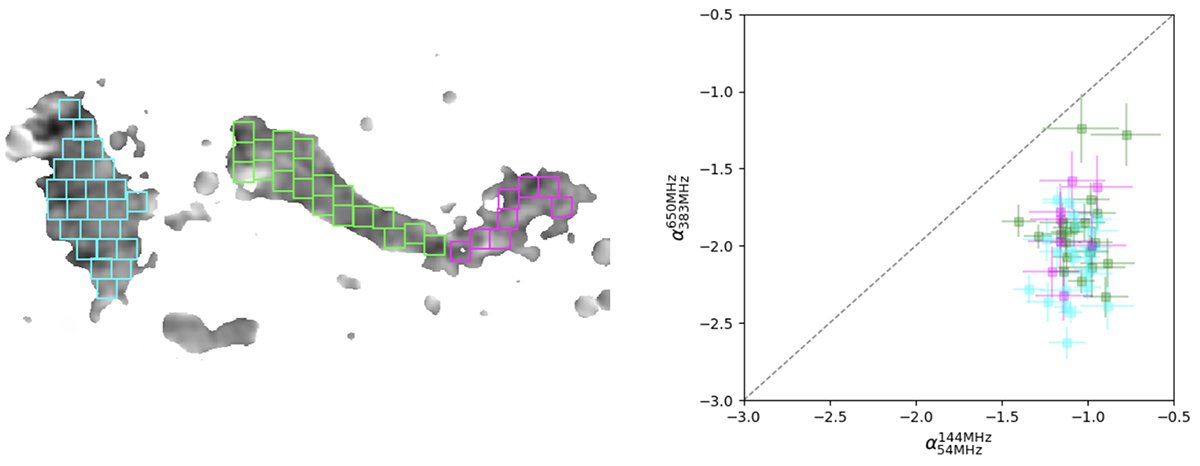
Fig. 8.
Download original image
Color-color plot for different regions in the source obtained using images at 54 MHz, 144 MHz, 383 MHz and 650 MHz with a PSF size of 15″. The gray dashed line represents the place where ![]() . The regions used to extract the values are shown in the left panel, overlaid on the spectral index map in the range 383–650 MHz.
. The regions used to extract the values are shown in the left panel, overlaid on the spectral index map in the range 383–650 MHz.
Current usage metrics show cumulative count of Article Views (full-text article views including HTML views, PDF and ePub downloads, according to the available data) and Abstracts Views on Vision4Press platform.
Data correspond to usage on the plateform after 2015. The current usage metrics is available 48-96 hours after online publication and is updated daily on week days.
Initial download of the metrics may take a while.