Open Access
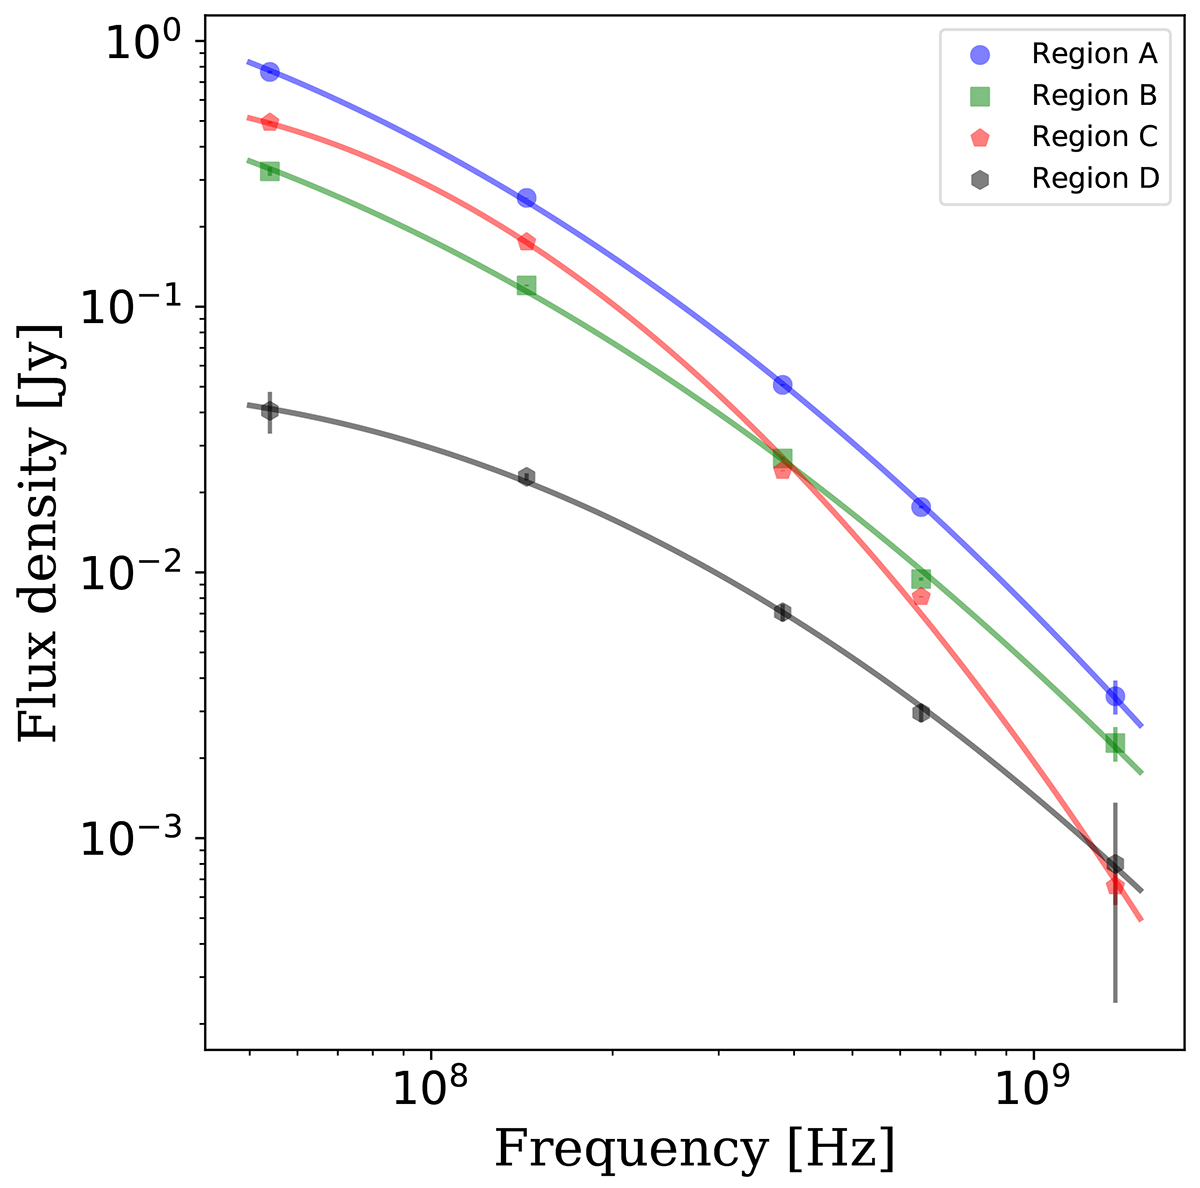
Fig. 7.
Download original image
Integrated flux densities of the source components listed in Table 2. Lines show second-order polynomial fits to the data points to highlight the spectrum shape.
Current usage metrics show cumulative count of Article Views (full-text article views including HTML views, PDF and ePub downloads, according to the available data) and Abstracts Views on Vision4Press platform.
Data correspond to usage on the plateform after 2015. The current usage metrics is available 48-96 hours after online publication and is updated daily on week days.
Initial download of the metrics may take a while.