Fig. 6.
Download original image
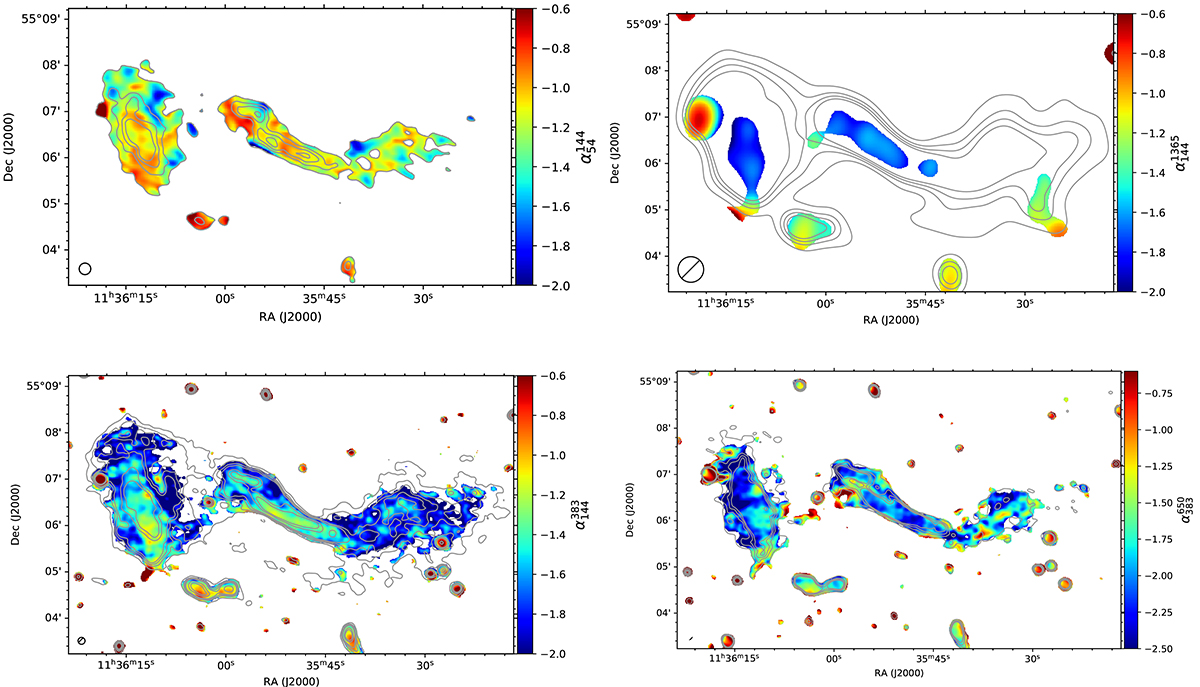
Spectral index maps between different frequencies. Top-left panel: ![]() (LOFAR/LBA – LOFAR/HBA) spectral index map. Shown are LBA contours at levels of [−5, 5, 9, 12, 15]σ and only pixels with values above 5σ in both maps are taken into account. LBA: σ = 1.32 mJy PSF−1, HBA: σ = 0.13 mJy PSF−1. Assumed flux scale accuracy is 20%. PSF size: 15″. Top-right panel:
(LOFAR/LBA – LOFAR/HBA) spectral index map. Shown are LBA contours at levels of [−5, 5, 9, 12, 15]σ and only pixels with values above 5σ in both maps are taken into account. LBA: σ = 1.32 mJy PSF−1, HBA: σ = 0.13 mJy PSF−1. Assumed flux scale accuracy is 20%. PSF size: 15″. Top-right panel: ![]() (LOFAR/HBA – APERTIF) spectral index map for pixels with values above 3σ. Shown are HBA contours at [−5, 5, 9, 12, 15]σ. HBA: σ = 0.6 mJy PSF−1, WSRT: σ = 0.1 mJy PSF−1. Assumed flux scale accuracy: HBA – 20%, WSRT – 5%. PSF: 33″. Bottom-left panel:
(LOFAR/HBA – APERTIF) spectral index map for pixels with values above 3σ. Shown are HBA contours at [−5, 5, 9, 12, 15]σ. HBA: σ = 0.6 mJy PSF−1, WSRT: σ = 0.1 mJy PSF−1. Assumed flux scale accuracy: HBA – 20%, WSRT – 5%. PSF: 33″. Bottom-left panel: ![]() (LOFAR/HBA – GMRT) spectral index map. Shown are HBA contours at [−5, 5, 9, 12, 15, 27, 36.]σ. for pixels with values above 3 σ in both maps. Bottom-right panel:
(LOFAR/HBA – GMRT) spectral index map. Shown are HBA contours at [−5, 5, 9, 12, 15, 27, 36.]σ. for pixels with values above 3 σ in both maps. Bottom-right panel: ![]() (GMRT) spectral index map for pixels above 3σ. Shown are GMRT 385 MHz contours at [−5, 5, 9, 12, 15]σ. HBA: σ = 64.5 μJy PSF−1, GMRT: σ = 26.7 μJy PSF−1and 15 μJy PSF−1. Assumed flux scale accuracy: HBA – 20%, GMRT – 5%. PSF size: 9″. The corresponding error maps are shown in Fig. B.1.
(GMRT) spectral index map for pixels above 3σ. Shown are GMRT 385 MHz contours at [−5, 5, 9, 12, 15]σ. HBA: σ = 64.5 μJy PSF−1, GMRT: σ = 26.7 μJy PSF−1and 15 μJy PSF−1. Assumed flux scale accuracy: HBA – 20%, GMRT – 5%. PSF size: 9″. The corresponding error maps are shown in Fig. B.1.
Current usage metrics show cumulative count of Article Views (full-text article views including HTML views, PDF and ePub downloads, according to the available data) and Abstracts Views on Vision4Press platform.
Data correspond to usage on the plateform after 2015. The current usage metrics is available 48-96 hours after online publication and is updated daily on week days.
Initial download of the metrics may take a while.