Fig. 5.
Download original image
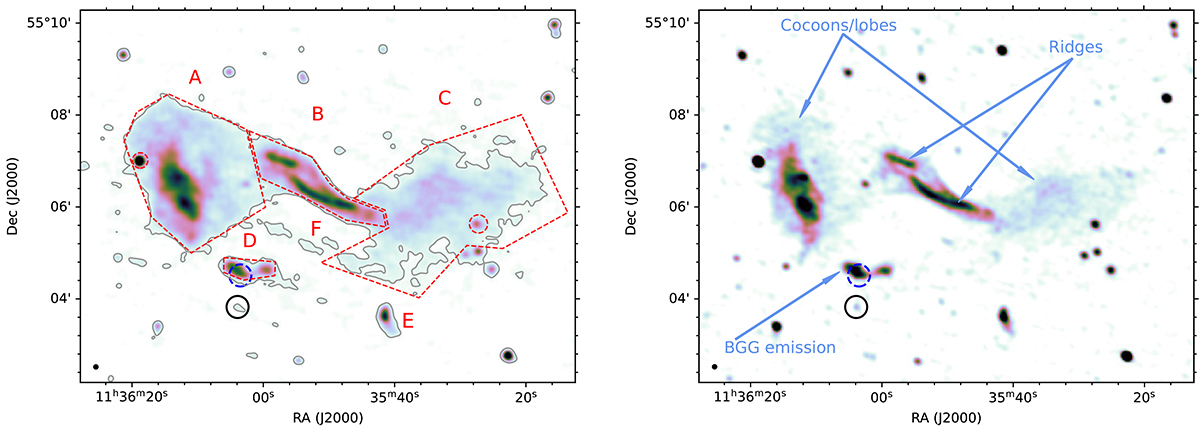
LOFAR 144 MHz (left panel) and uGMRT 383 MHz (right panel) intensity maps . The LOFAR map levels go from σ = 88.5 μJy PSF−1 to 4 mJy PSF−1, and one contour at a level of 3σ is overlaid over the LOFAR intensity map. Regions of interest discussed in the text are marked with a red dashed line and labeled; excluded are bright compact sources embedded in the extended emission. The corresponding uGMRT map levels are 10 μJy PSF−1 and 1 mJy PSF−1correspondingly. The PSF size of 9″ is shown in the lower left corner. The position of the BGG and its companion are outlined with dashed blue and full black circles respectively and source features of interest are labeled.
Current usage metrics show cumulative count of Article Views (full-text article views including HTML views, PDF and ePub downloads, according to the available data) and Abstracts Views on Vision4Press platform.
Data correspond to usage on the plateform after 2015. The current usage metrics is available 48-96 hours after online publication and is updated daily on week days.
Initial download of the metrics may take a while.