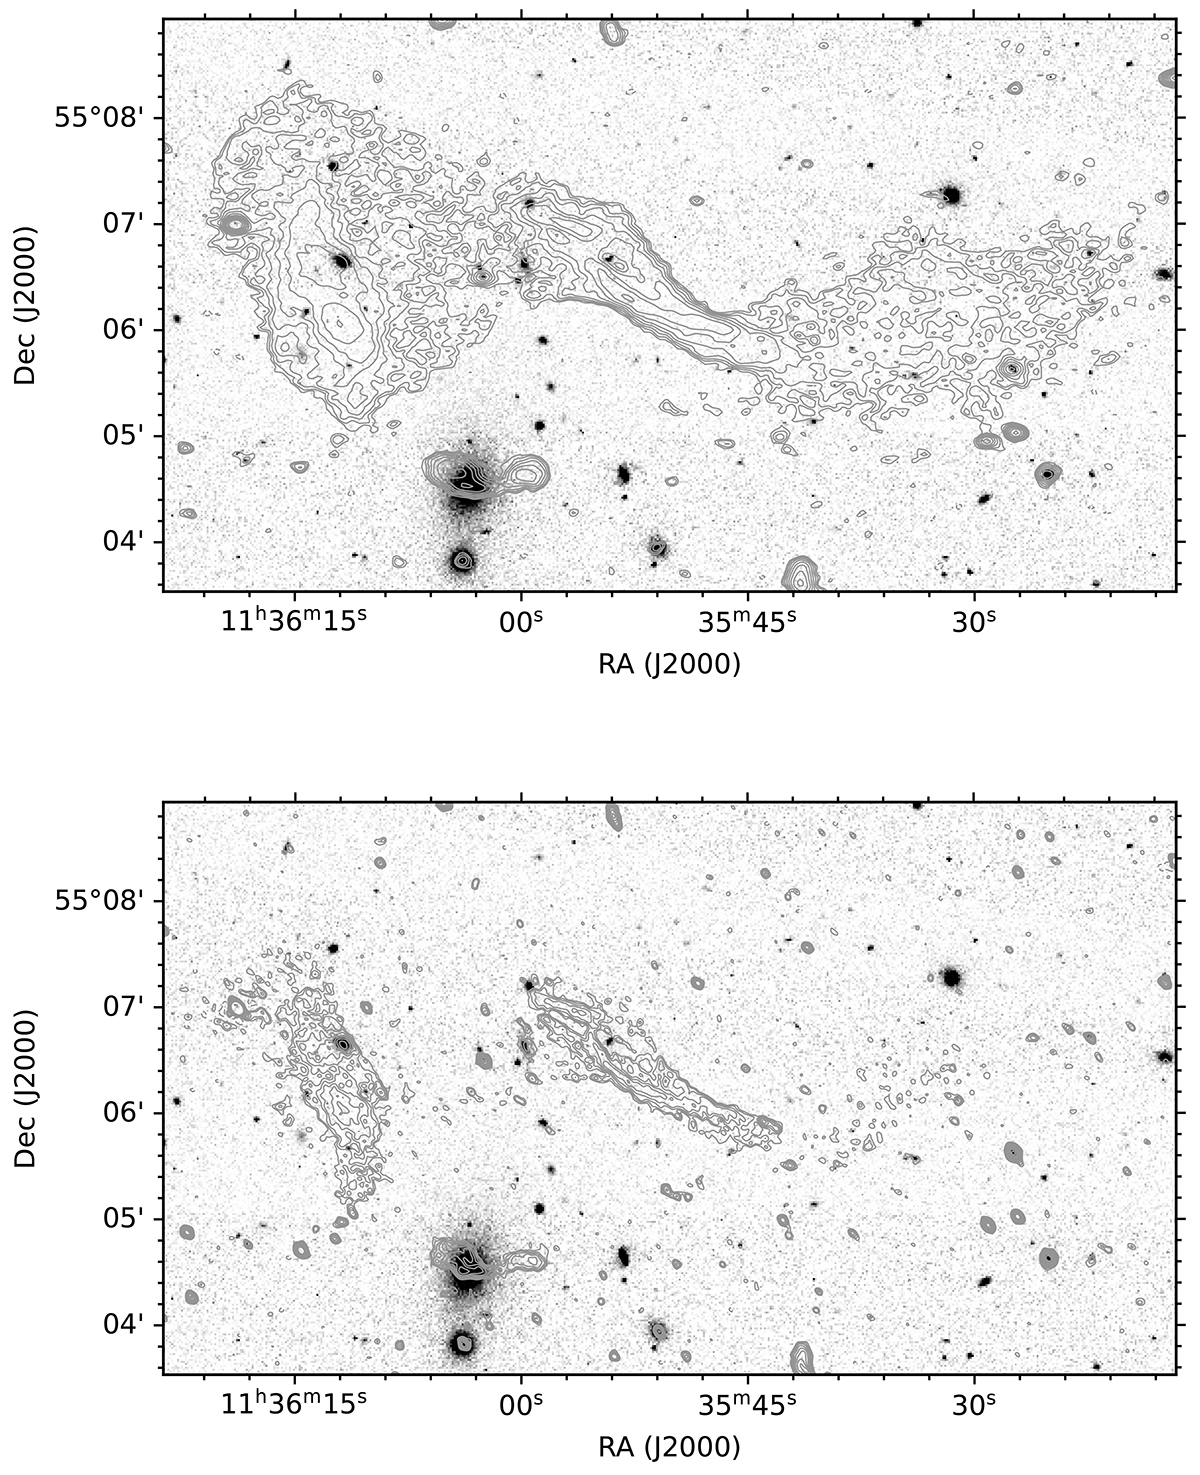
Fig. 4.
Download original image
PANSTARRS g band optical image centered on the target using an inverted grayscale mapping and linear stretch between levels of 10−3 and 250 × 10−3. Top panel: ten positive LOFAR radio contours at 144 MHz are overlaid in solid gray lines with levels at ![]() , where n goes from 0 to 9 in increments of 1. One negative contour level at −3σ is overlaid in a dashed gray line. Bottom panel: same as in the top panel, using the uGMRT band 4 image at 650 MHz. The radio images rms noise and resolution are listed in Table 1.
, where n goes from 0 to 9 in increments of 1. One negative contour level at −3σ is overlaid in a dashed gray line. Bottom panel: same as in the top panel, using the uGMRT band 4 image at 650 MHz. The radio images rms noise and resolution are listed in Table 1.
Current usage metrics show cumulative count of Article Views (full-text article views including HTML views, PDF and ePub downloads, according to the available data) and Abstracts Views on Vision4Press platform.
Data correspond to usage on the plateform after 2015. The current usage metrics is available 48-96 hours after online publication and is updated daily on week days.
Initial download of the metrics may take a while.