Fig. 9.
Download original image
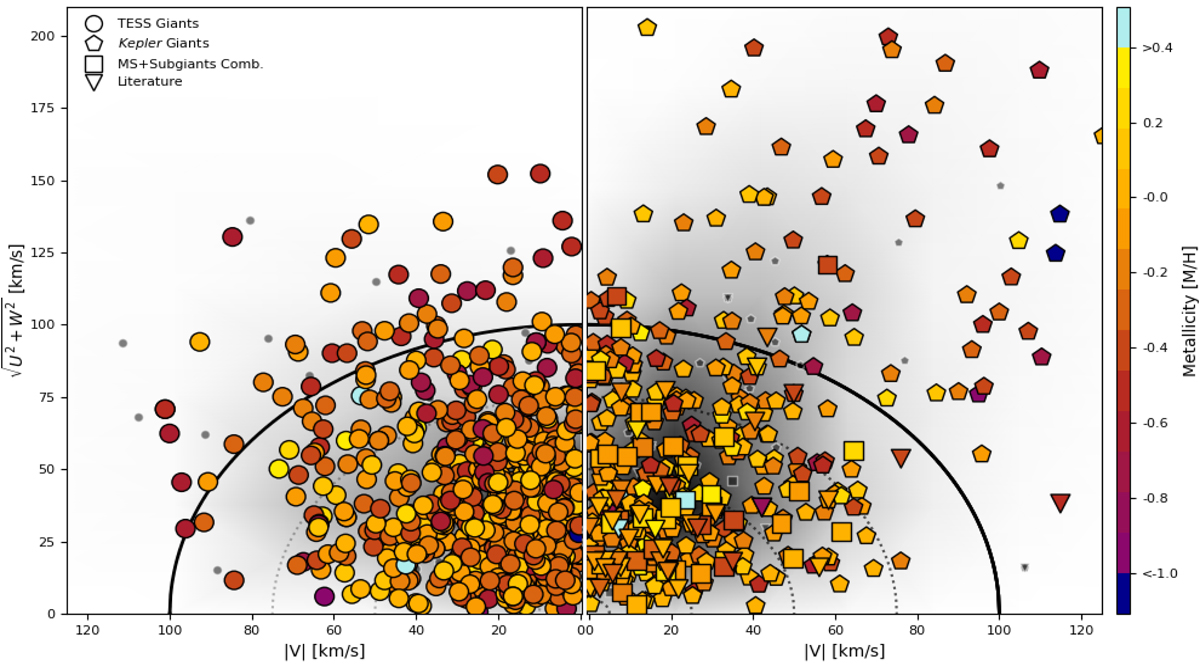
Distributions of the Galactic space velocities U, V, and W for the red giants in the TESS, and red giants as well as main sequence stars in the Kepler and literature samples are shown in the left and right Toomre diagram, respectively. The color of the markers indicates the metallicity. We note that 9 candidate systems have velocity values outside the shown space velocity range in the left panel and 11 in the right panel. The small grey symbols represent the stars without a solution for the metallicity in the Gaia DR3. The thick black line marks the approximative separation between the galactic thin (X ≲ 100 km s−1) and thick disk (X ≳ 100 km s−1). The form of the markers corresponds to the different samples as presented in Fig. 1. The grey scale in the background shows the distribution of all stars with seismic values in the Kepler and TESS samples.
Current usage metrics show cumulative count of Article Views (full-text article views including HTML views, PDF and ePub downloads, according to the available data) and Abstracts Views on Vision4Press platform.
Data correspond to usage on the plateform after 2015. The current usage metrics is available 48-96 hours after online publication and is updated daily on week days.
Initial download of the metrics may take a while.