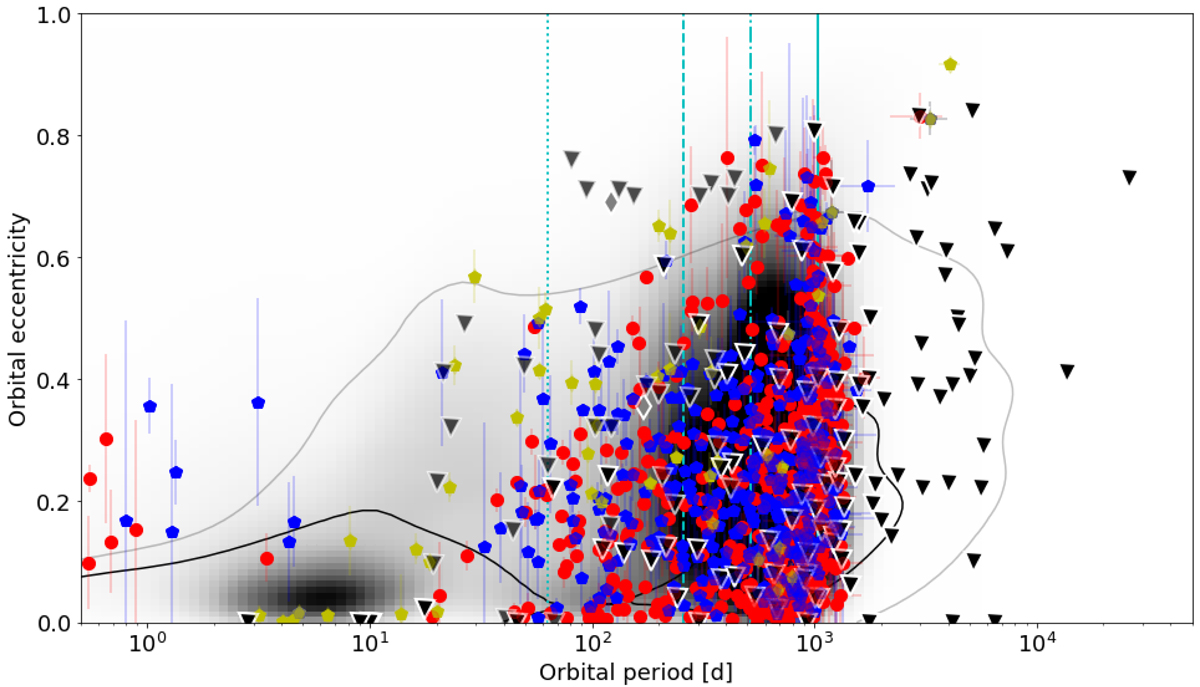
Fig. 8.
Download original image
Distribution of the sample of binary-candidate systems from Gaia DR3, hosting evolved stars as their primary stellar component. Colored dots mark systems with detected solar-like oscillations in the components primaries (blue and red mark stars from the sample of giants in Kepler and TESS; yellow indicates main sequence stars observed with Kepler). Systems from the published Kepler sample with an oscillating red giant primary are depicted as black triangles. Systems hosting two oscillating red giant components (PB2) are shown as grey diamonds. The background density plot represents the distribution of all systems in Gaia DR3 TBO with full orbital solutions. The thin and thick black contour lines show the isocontour regions of densely populated regions and the envelope of the distribution of SB9 binary systems, respectively. The vertical solid, dash-dotted, dashed, and dotted lines represent the 1034 d baseline of Gaia DR3 as well as one half and one-fourth of it and the ∼63 d precession period of the satellite.
Current usage metrics show cumulative count of Article Views (full-text article views including HTML views, PDF and ePub downloads, according to the available data) and Abstracts Views on Vision4Press platform.
Data correspond to usage on the plateform after 2015. The current usage metrics is available 48-96 hours after online publication and is updated daily on week days.
Initial download of the metrics may take a while.