Fig. 6.
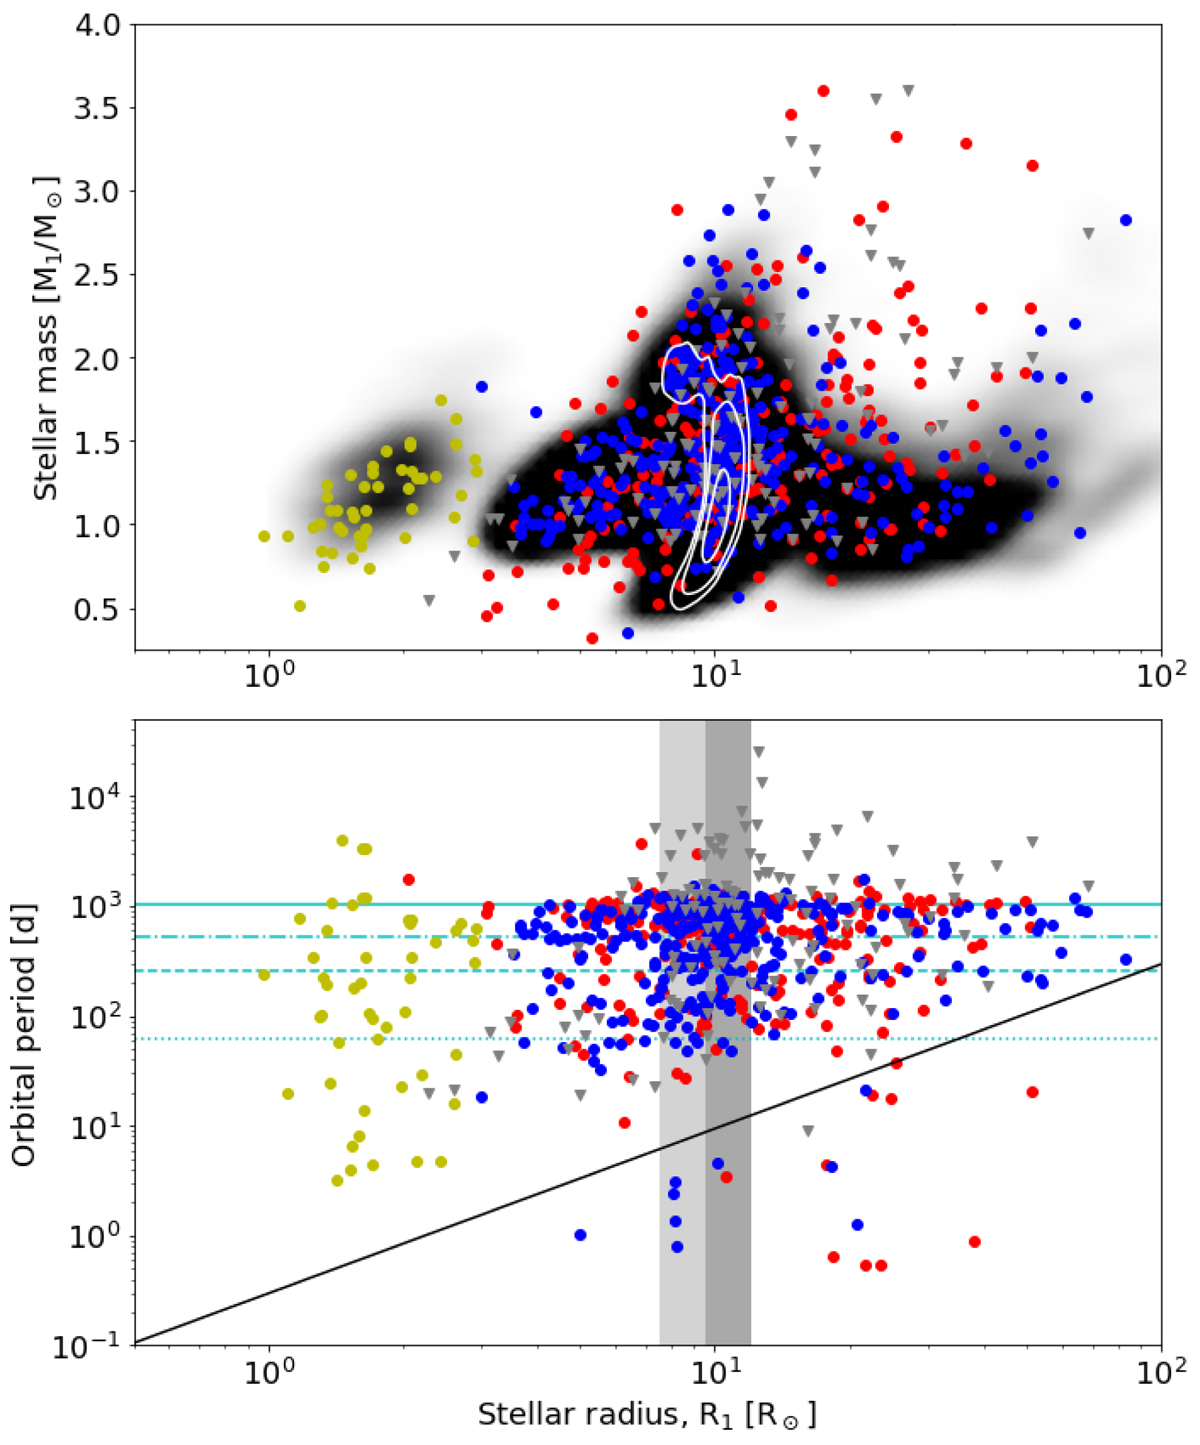
Download original image
Characterisation of the set of binary candidates from Gaia DR3. Top panel shows the distribution of the binary candidates in the radius-mass plane. The probability density map in the background shows the distribution of all oscillating stars in the Kepler sample. Bottom panel provides a test of the feasibility of the orbital period as a function of the stellar radius. The black line resembles the estimated minimum period for a system to fill the Roche lobe of its giant. The dark and light shaded area mark the ranges in which RC and 2RC stars are expected, respectively. The meanings of the yellow, blue, and red symbols are similar to those of Fig. 1 for the dwarfs and giants from the Kepler sample and giants from the TESS sample, respectively. The literature sample is represented by grey triangles. The horizontal lines (from top to bottom) indicate the full, half, one fourth of the timebase, and the ∼63 days precession period of Gaia DR3.
Current usage metrics show cumulative count of Article Views (full-text article views including HTML views, PDF and ePub downloads, according to the available data) and Abstracts Views on Vision4Press platform.
Data correspond to usage on the plateform after 2015. The current usage metrics is available 48-96 hours after online publication and is updated daily on week days.
Initial download of the metrics may take a while.