Fig. A.1.
Download original image
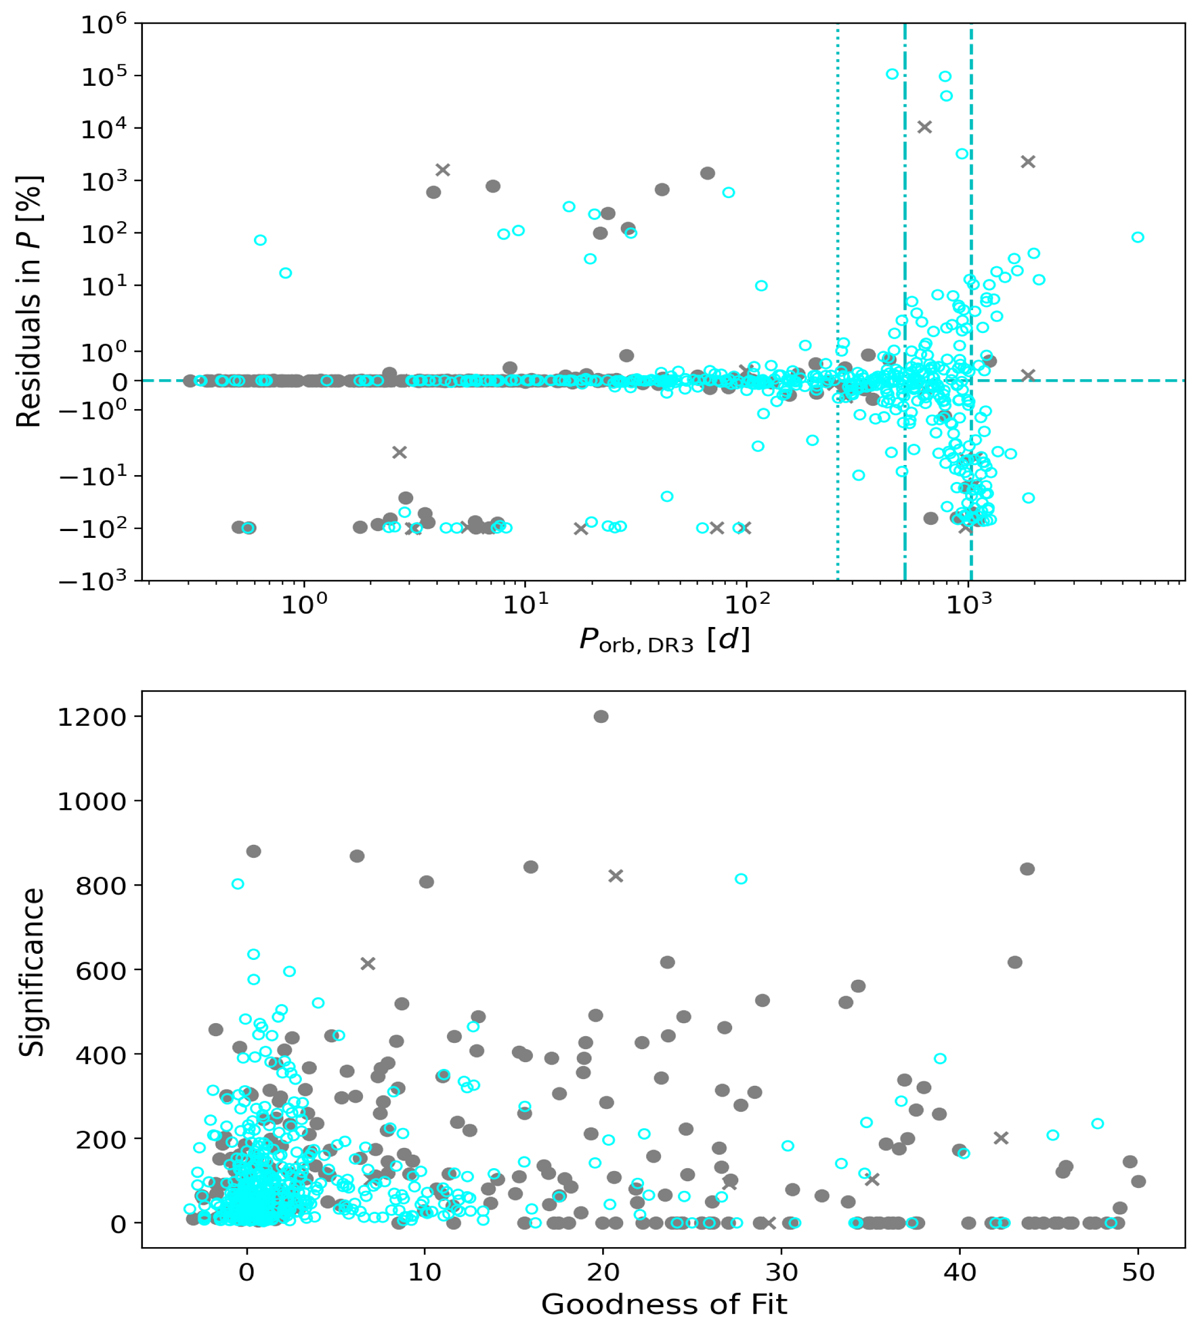
Fractional residuals of the period from the comparison of Gaia DR3 and SB9 in percent is shown in the top panel. The bottom panel shows the goodness-of-fit and significance parameters originating from the binary solutions in Gaia DR3 plotted against each other. The vertical lines from left to right indicate the precession period of the Gaia satellite of 69 days, as well as the one-fourth, half, and full duration of the Gaia DR3, ∼250, ∼500, and 1035 days, respectively. The meaning of the used symbols and colors is similar to Fig. 2.
Current usage metrics show cumulative count of Article Views (full-text article views including HTML views, PDF and ePub downloads, according to the available data) and Abstracts Views on Vision4Press platform.
Data correspond to usage on the plateform after 2015. The current usage metrics is available 48-96 hours after online publication and is updated daily on week days.
Initial download of the metrics may take a while.