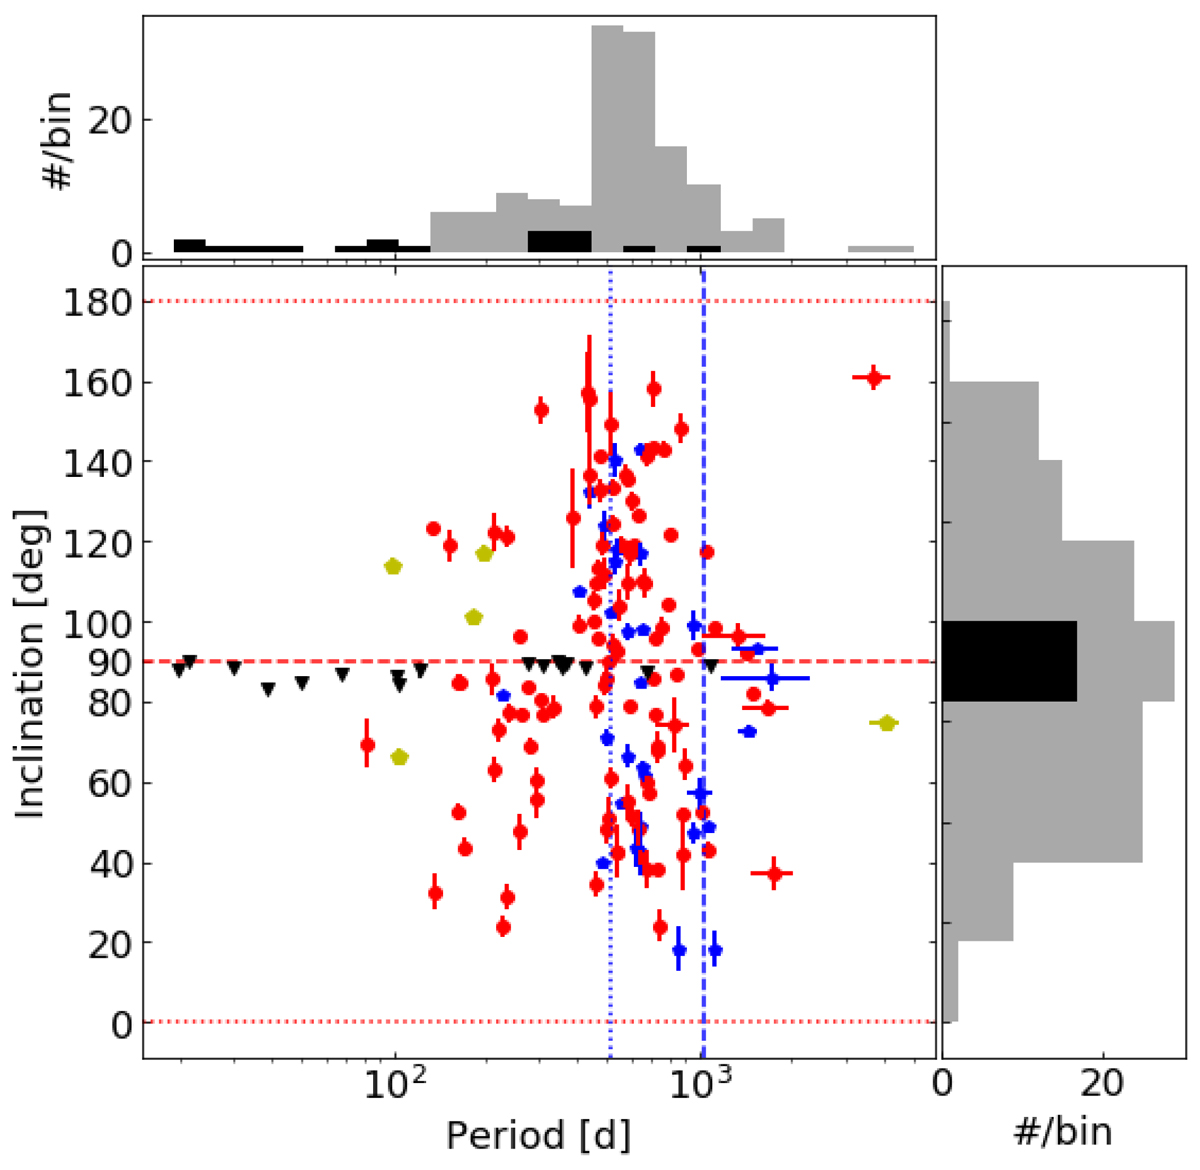
Fig. 17.
Download original image
Distributions of the inclinations and orbital period of astrometric binaries hosting a solar-like oscillating primary. The red dots indicate oscillating giants, observed by TESS; blue and yellow symbols mark oscillating giants and main-sequenc stars observed by Kepler. Black triangles indicate giants in eclipsing binary systems from the Kepler literature sample The vertical dashed and dotted blue lines mark the full and half length of the Gaia DR3 timebase, respectively. The horizontal dashed line marks the inclination for the edge-on orientation, while the dotted lines indicate the plane-on orientation of an orbit. The grey and black histogram indicate the distribution of the sample of astrometric binaries from Gaia DR3 and the literature sample of eclipsing binaries from Kepler.
Current usage metrics show cumulative count of Article Views (full-text article views including HTML views, PDF and ePub downloads, according to the available data) and Abstracts Views on Vision4Press platform.
Data correspond to usage on the plateform after 2015. The current usage metrics is available 48-96 hours after online publication and is updated daily on week days.
Initial download of the metrics may take a while.