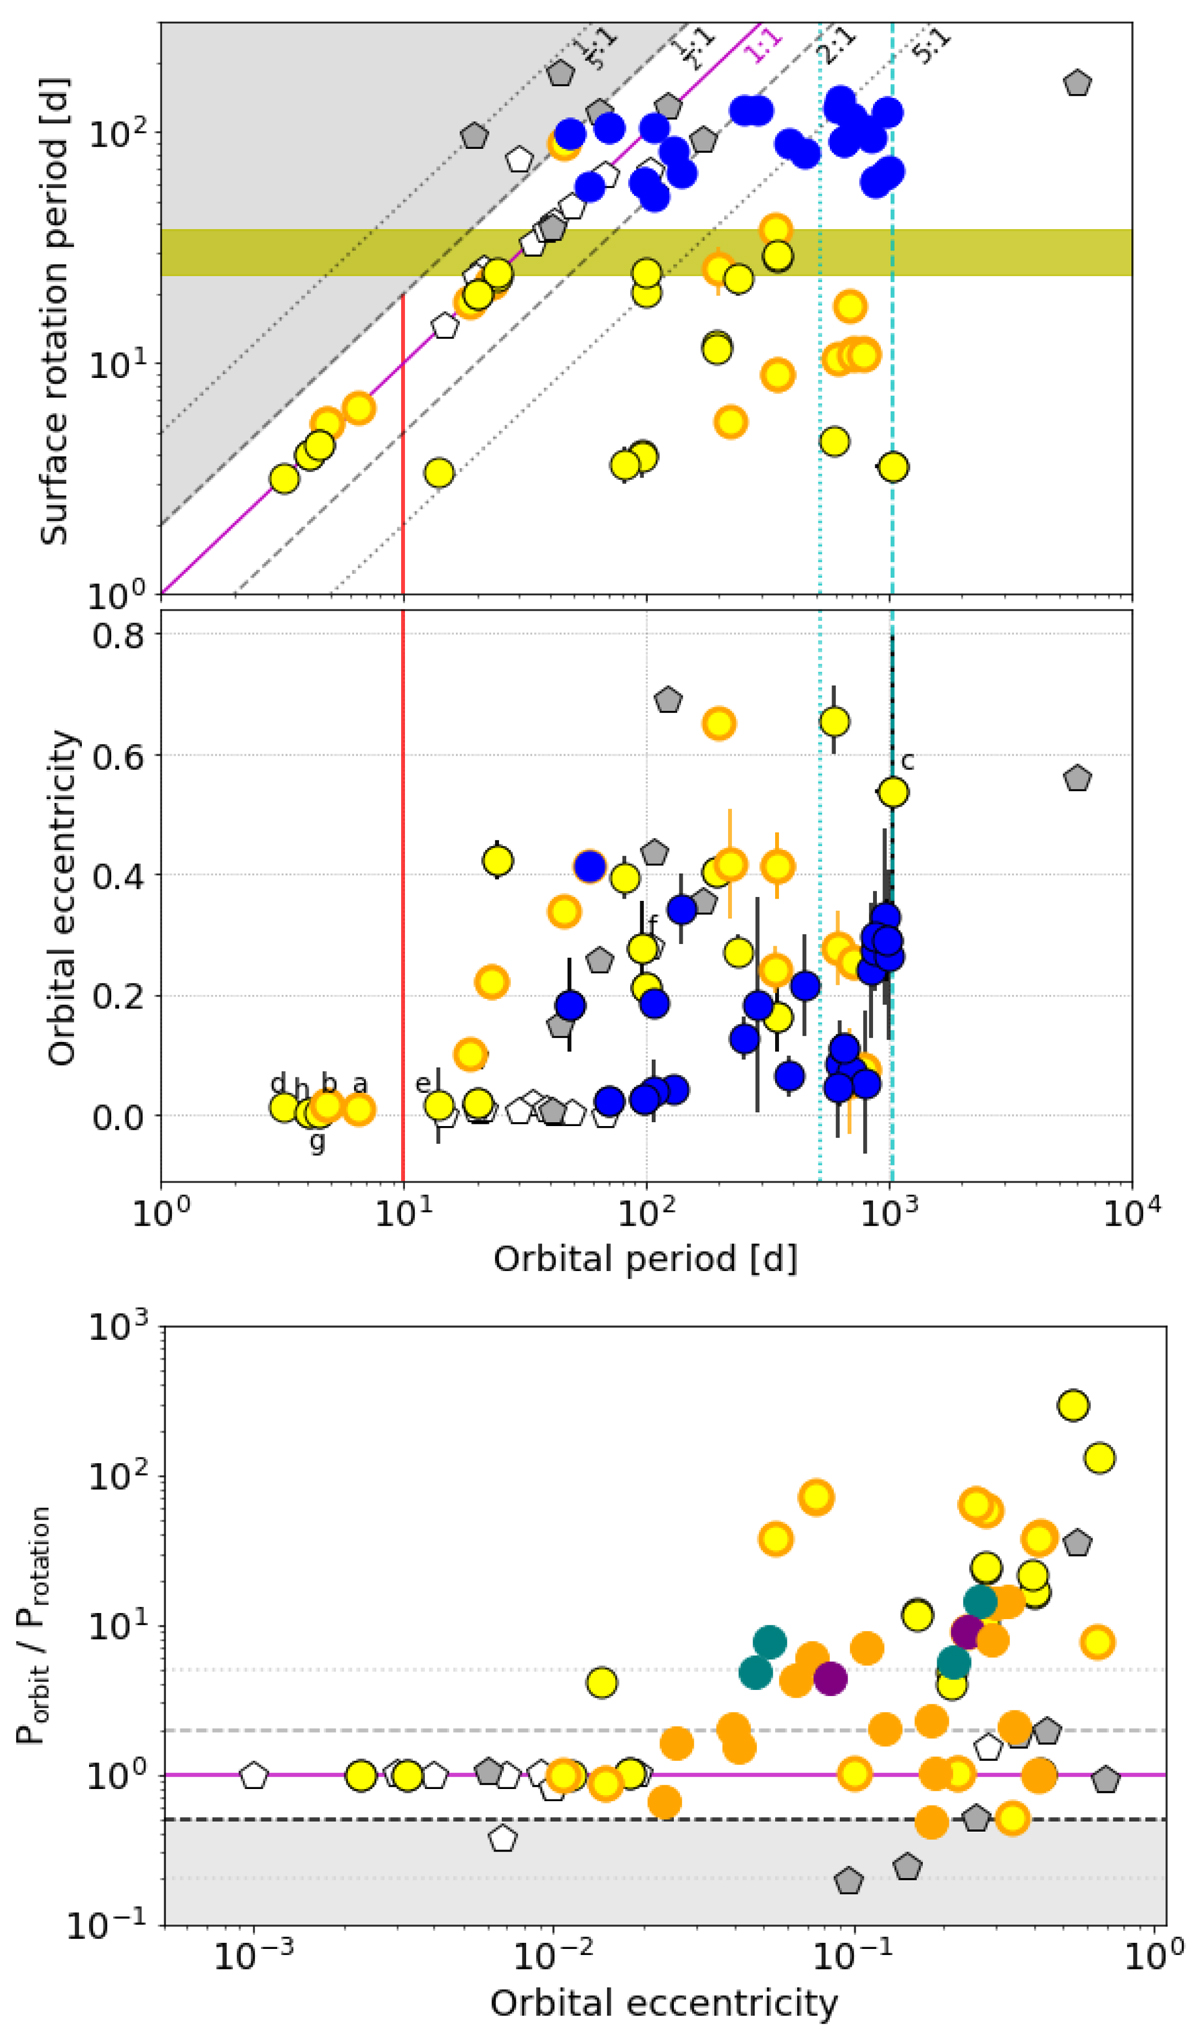
Fig. 14.
Download original image
Synchronization and circularization of binary systems, hosting solar-like oscillators. The top and middle panel show the surface rotation periods of the primary and orbital eccentricities for binary systems as a function of their orbital period, respectively. The bottom panel presents the ratio Porbit/Protation as a function of the orbital eccentricity. Yellow, orange, and blue dots indicate dwarfs, subgiants and red giants, observed with Kepler, respectively. Grey pentagons indicate systems reported previously in the literature. Filled and open symbols denote oscillating and non-oscillating primaries, respectively. The inclined lines represent the resonance ratios Porb:Prot as indicated to the right of the line. The solid magenta line indicates the synchronisation of the surface rotation with the orbit (Porb = Prot). The grey shaded area depicts the region in which the dynamical tide cannot be excited (2 ⋅ Porb < Prot). The yellow shaded area indicates the range of the solar siderial surface rotation. The solid vertical red line indicates the limiting period for synchronization and circularization on the main sequence (Pcirc ≃ 10 d). The vertical dashed and dotted lines indicate the length and half the length of the Gaia DR3 mission timebase.
Current usage metrics show cumulative count of Article Views (full-text article views including HTML views, PDF and ePub downloads, according to the available data) and Abstracts Views on Vision4Press platform.
Data correspond to usage on the plateform after 2015. The current usage metrics is available 48-96 hours after online publication and is updated daily on week days.
Initial download of the metrics may take a while.