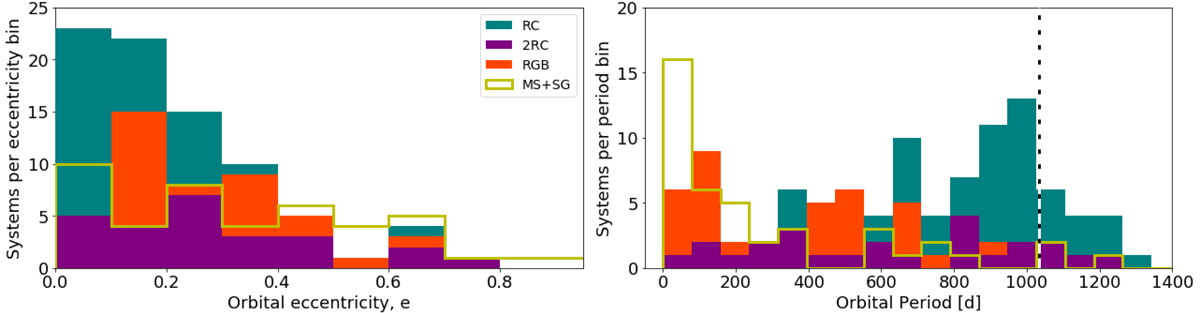
Fig. 13.
Download original image
Distribution of orbital eccentricities, separated by evolutionary stage and channel. The left and right panel give the number of systems per eccentricity and period bin, respectively. The color distinguishes between the evolutionary states of secondary clump (2RC), red clump (RC), red giant branch (RGB) in purple, teal, and orange respectively. Because of their small number and nearby evolutionary state, main sequence and subgiant primaries are shown as one group in yellow (MS+SG). The vertical dashed line represents the 1034 days timebase of Gaia DR3.
Current usage metrics show cumulative count of Article Views (full-text article views including HTML views, PDF and ePub downloads, according to the available data) and Abstracts Views on Vision4Press platform.
Data correspond to usage on the plateform after 2015. The current usage metrics is available 48-96 hours after online publication and is updated daily on week days.
Initial download of the metrics may take a while.