Fig. 12.
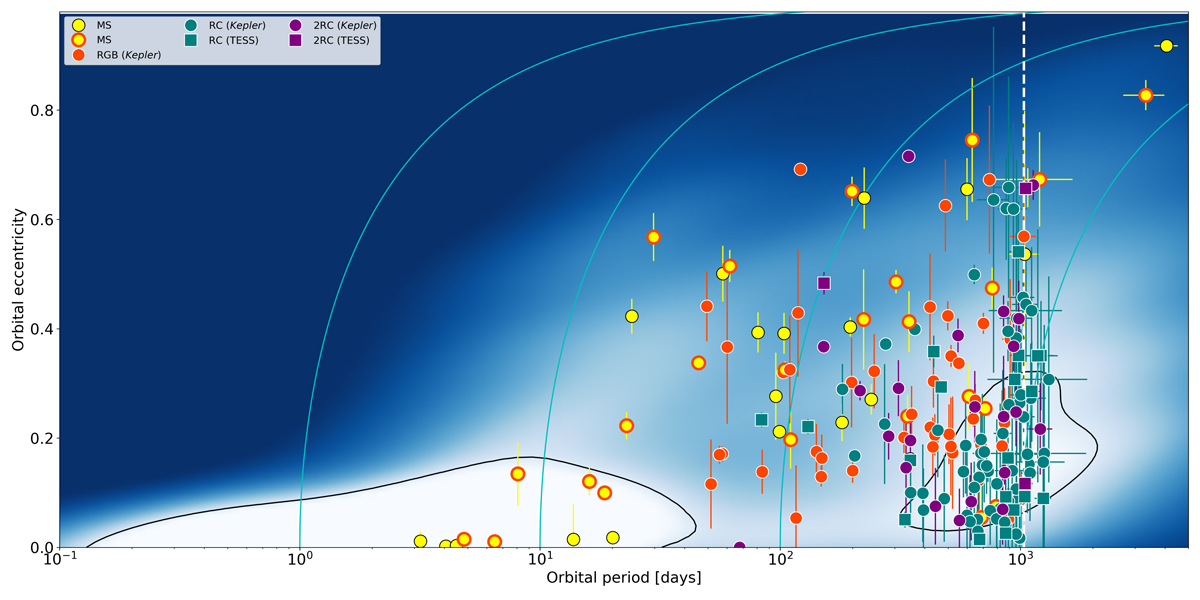
Download original image
Orbital periods and eccentricities of the binary systems hosting a primary with identified evolutionary stages. The particular color and the shape of the data points indicate the seismically inferred evolutionary stage and the space mission this star has been observed with, respectively. The light-blue lines indicate the arcs of constant angular momentum in the e − P plane for circular orbital periods for 1, 10, 100, and 1000 days. The background color map represents the normalized probability-density distribution of the full SB9 sample. The black lines envelop the regions with a density of at least seven times the median probability density. The white vertical dashed line represents the 1034 d timebase of Gaia DR3.
Current usage metrics show cumulative count of Article Views (full-text article views including HTML views, PDF and ePub downloads, according to the available data) and Abstracts Views on Vision4Press platform.
Data correspond to usage on the plateform after 2015. The current usage metrics is available 48-96 hours after online publication and is updated daily on week days.
Initial download of the metrics may take a while.