Fig. 11.
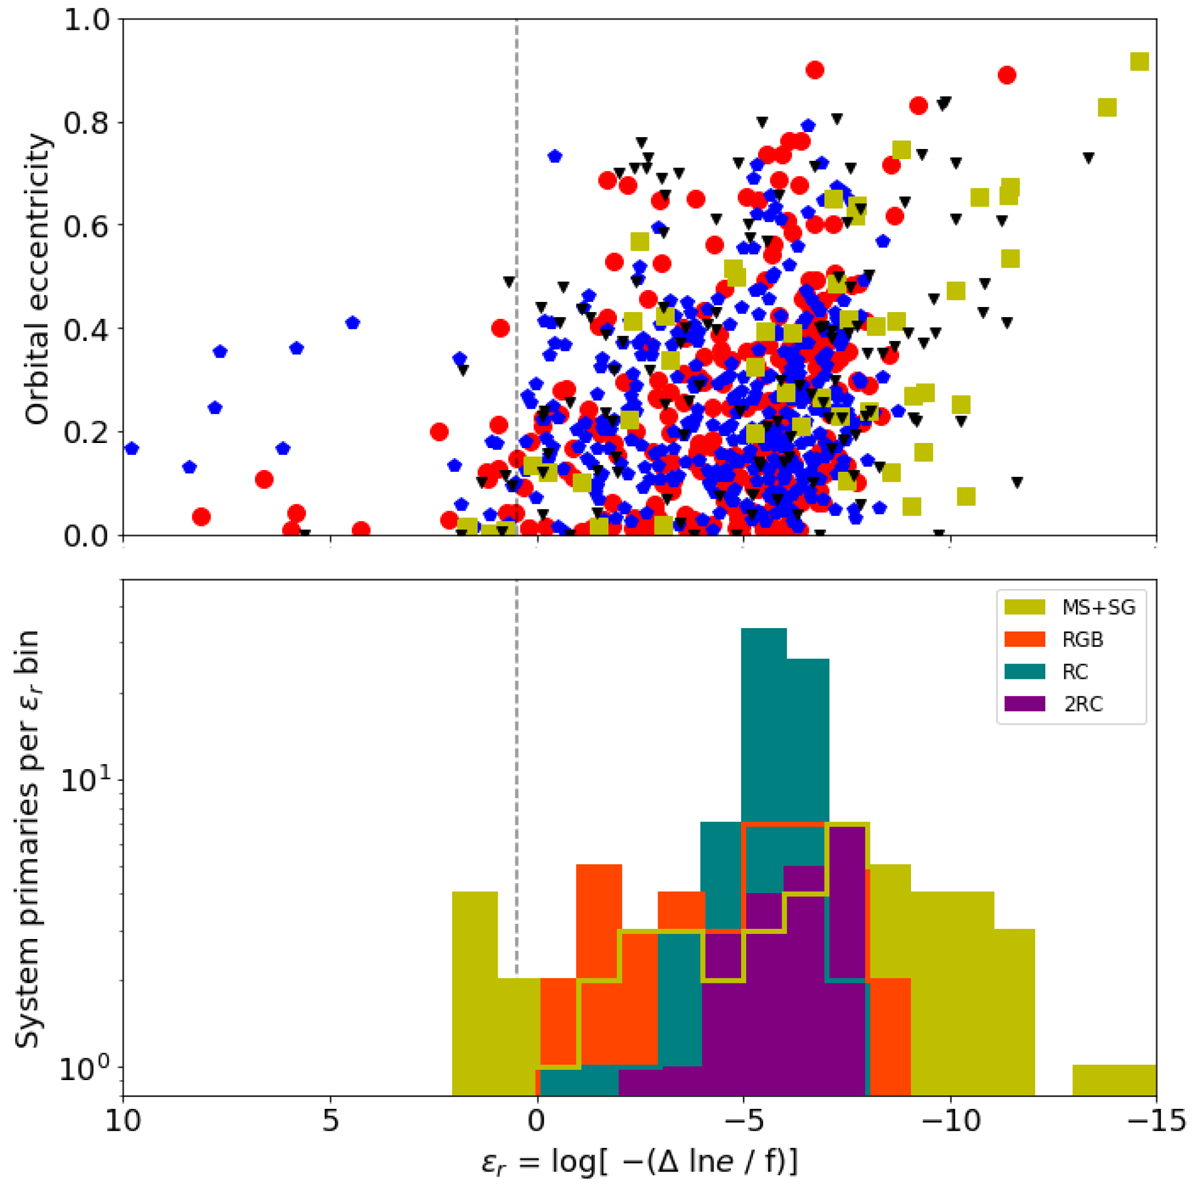
Download original image
Orbital eccentricity of the parameterized time scale of the tidally driven orbital circularization, εr. The top panel shows the position of all binary candidates in the parameter plane. The histogram in the bottom panel depicts the distribution of εr for the systems with an oscillating primary, for which the evolutionary state could be determind from seismology. The color distinguishes between the evolutionary states of secondary clump (2RC), red clump (RC), red giant branch (RGB) in purple, teal, and orange, respectively. Because of their small number and nearby evolutionary state, main sequence and subgiant primaries are shown as one group in yellow (MS+SG). The grey dashed line marked the proposed value of εcrit.
Current usage metrics show cumulative count of Article Views (full-text article views including HTML views, PDF and ePub downloads, according to the available data) and Abstracts Views on Vision4Press platform.
Data correspond to usage on the plateform after 2015. The current usage metrics is available 48-96 hours after online publication and is updated daily on week days.
Initial download of the metrics may take a while.