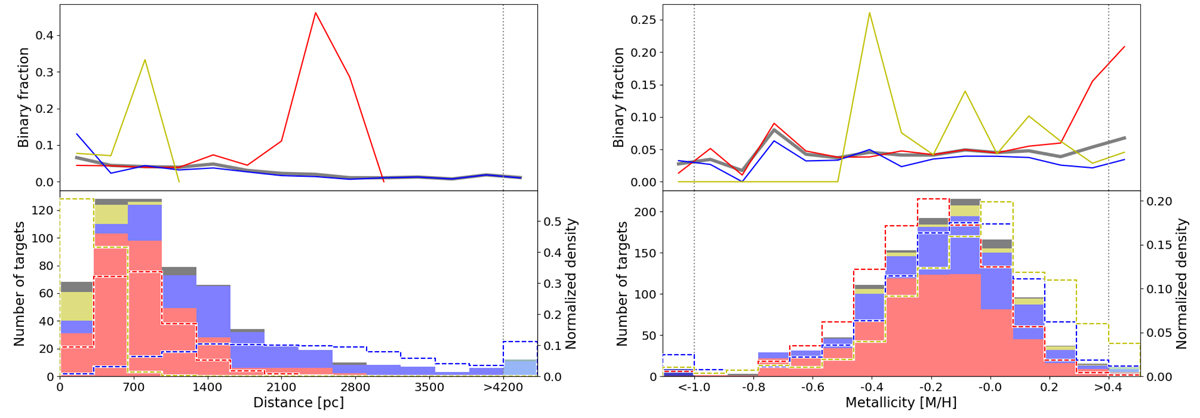
Fig. 10.
Download original image
Binary fractions and distribution of the samples as a function of the distance (left panel) and metallicity (right panel). The top panels visualize the ratio of the number of binary candidates over the whole sample for each bin of the histogram in the bottom panel. The colors represent the samples of giants detected with TESS and the giants, and main sequence stars observed with Kepler as red, blue, and yellow, respectively. The thick grey line indicates the total binary fraction. The bottom panels depict the distribution of the distances and metallicities in a histogram. The filled bars correspond to the number of binary solutions of the samples. The samples have the same color as in the top panel, and the black bars represent the literature sample. For comparison, the dashed lines show the normalized density of the corresponding input samples in the same color. The first and last bar of the histogram in the bottom left panel represents all stars with a metallicity lower than −1 and bigger than 0.4 dex, respectively. For the histogram of the distance, the last bar indicates all systems with a distance higher than 4200 pc.
Current usage metrics show cumulative count of Article Views (full-text article views including HTML views, PDF and ePub downloads, according to the available data) and Abstracts Views on Vision4Press platform.
Data correspond to usage on the plateform after 2015. The current usage metrics is available 48-96 hours after online publication and is updated daily on week days.
Initial download of the metrics may take a while.