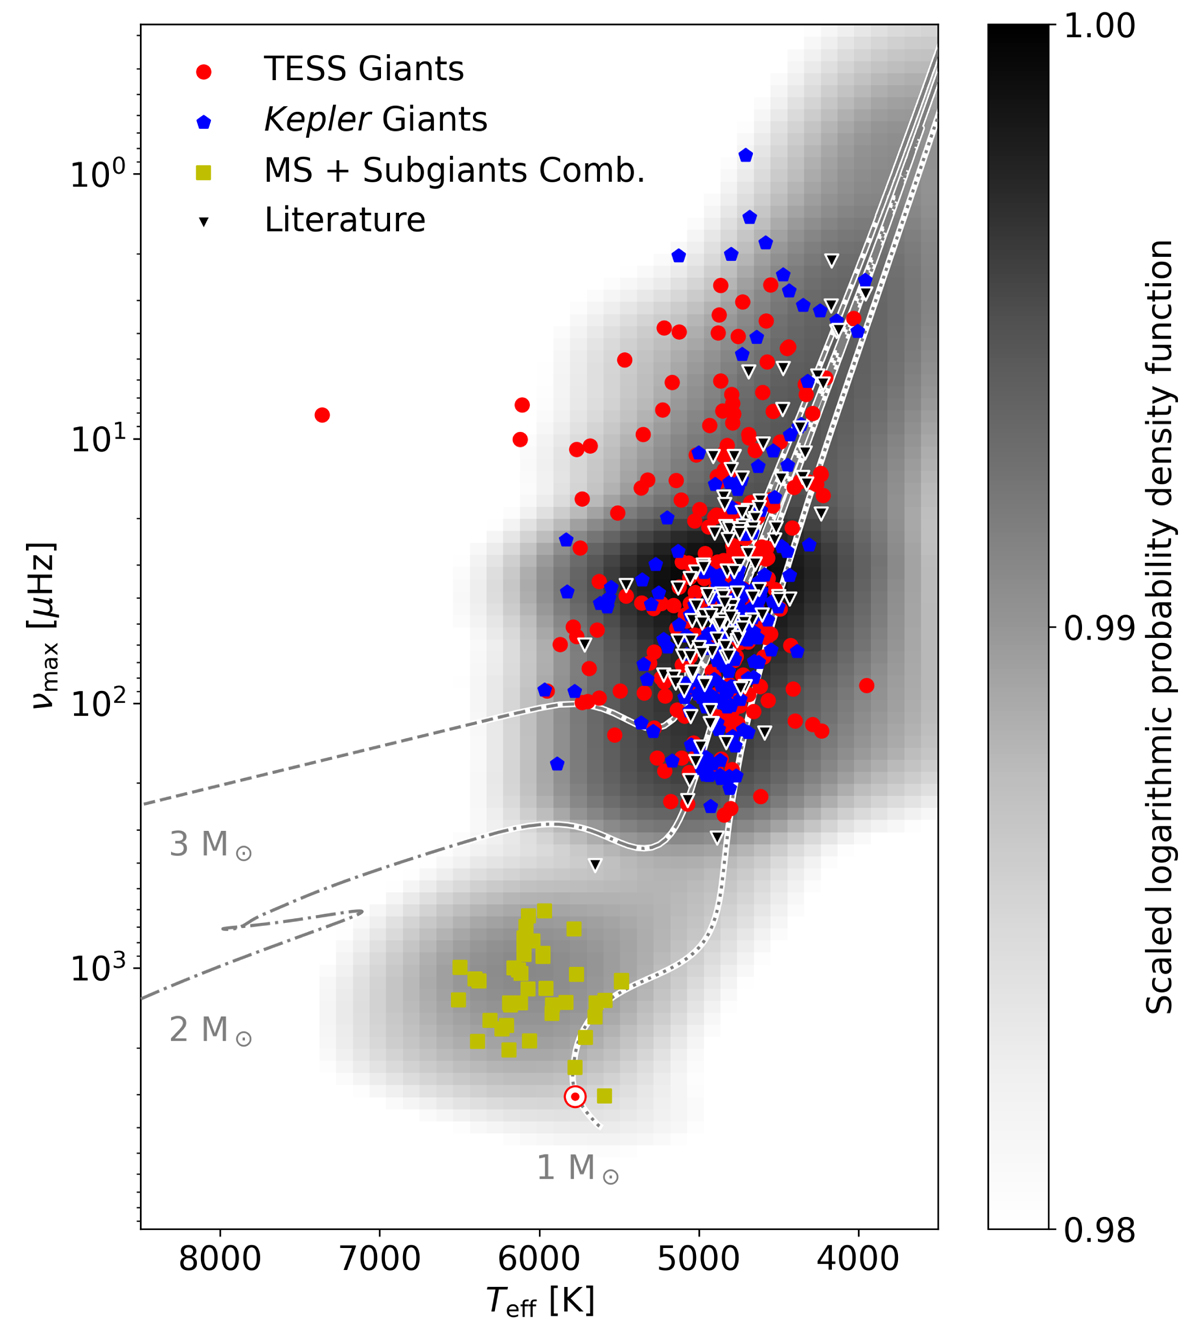
Fig. 1.
Download original image
Distribution of the sample in the seismic HRD with the frequency of the oscillation-power excess on the left vertical axis. The colored symbols show binary candidates reported in Gaia DR3 hosting giant or main-sequence solar-like oscillators. Red marks red giants with asteroseismic solutions obtained from TESS data. Blue denotes red giants with asteroseismic solutions from the Kepler mission. Yellow shows oscillating solar-like main sequence stars and subgiants, observed with Kepler. In black triangles, the literature sample is depicted. Only systems with APOGEE temperatures are shown. For the literature sample, all targets with asteroseismic solutions are shown, independently of whether a solution in the Gaia DR3 TBO catalog exists. With grey lines, the evolutionary paths for stars of 1 M⊙, 2 M⊙, and 3 M⊙ and with solar metallicity are shown. The grey probability distribution, underlying the scatter and curves, is the distribution of all targets with asteroseismic solutions of the above-mentioned catalogs.
Current usage metrics show cumulative count of Article Views (full-text article views including HTML views, PDF and ePub downloads, according to the available data) and Abstracts Views on Vision4Press platform.
Data correspond to usage on the plateform after 2015. The current usage metrics is available 48-96 hours after online publication and is updated daily on week days.
Initial download of the metrics may take a while.