Fig. 4
Download original image
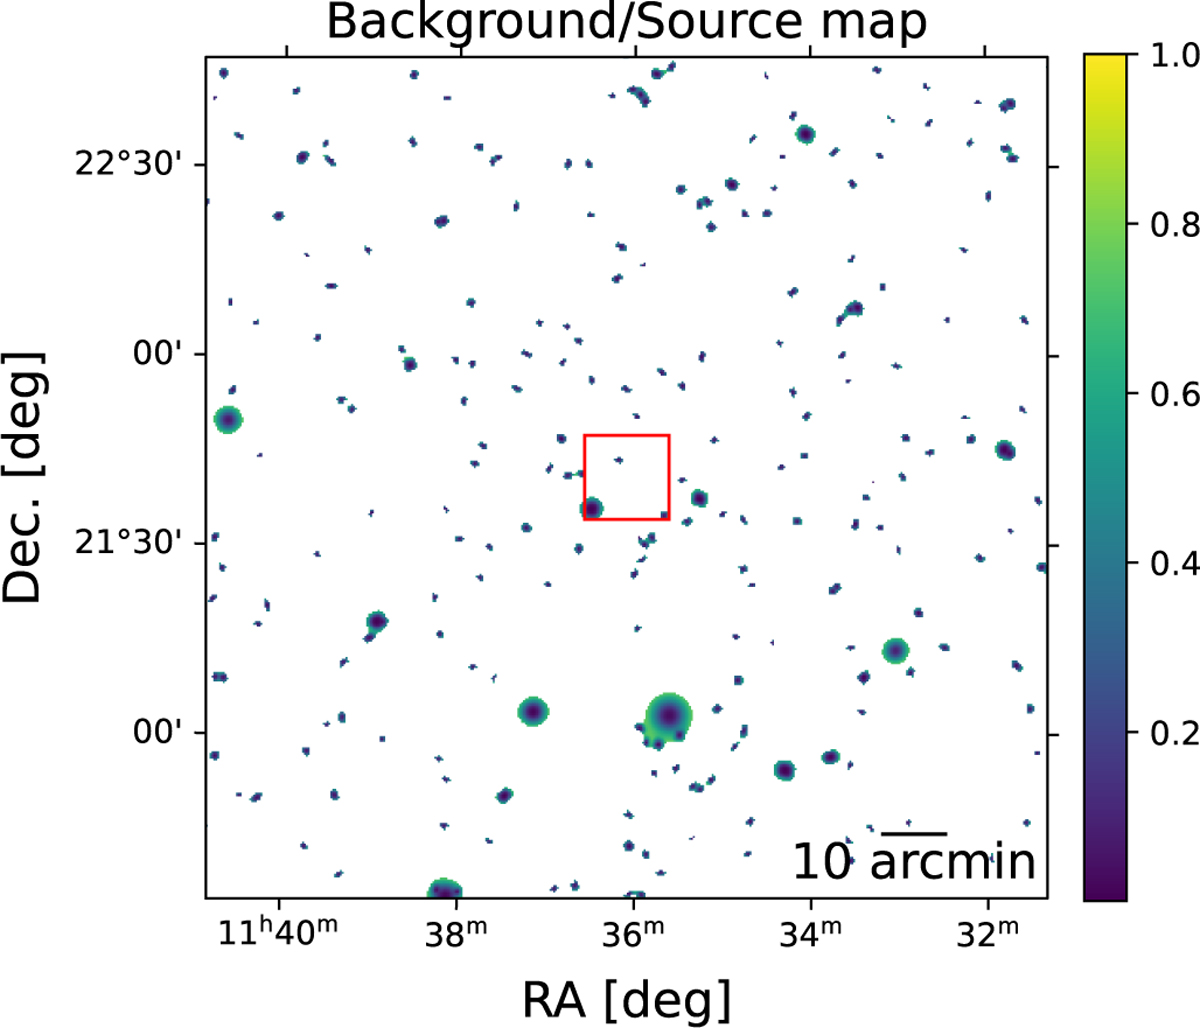
Ratio between the background map (source-free) and the source map (detected sources + background). Pixels, where the ratio is smaller than 0.8, are displayed. This map is used to assign the positional flag and indicate that the upper limit calculation will be affected by detected sources. If the area used for the aperture photometry intersects or includes such a region, the “close neighbor” flag is set to 1 for this pixel, otherwise 0. The red square highlights the sky region displayed in Fig. 2.
Current usage metrics show cumulative count of Article Views (full-text article views including HTML views, PDF and ePub downloads, according to the available data) and Abstracts Views on Vision4Press platform.
Data correspond to usage on the plateform after 2015. The current usage metrics is available 48-96 hours after online publication and is updated daily on week days.
Initial download of the metrics may take a while.