Fig. 2
Download original image
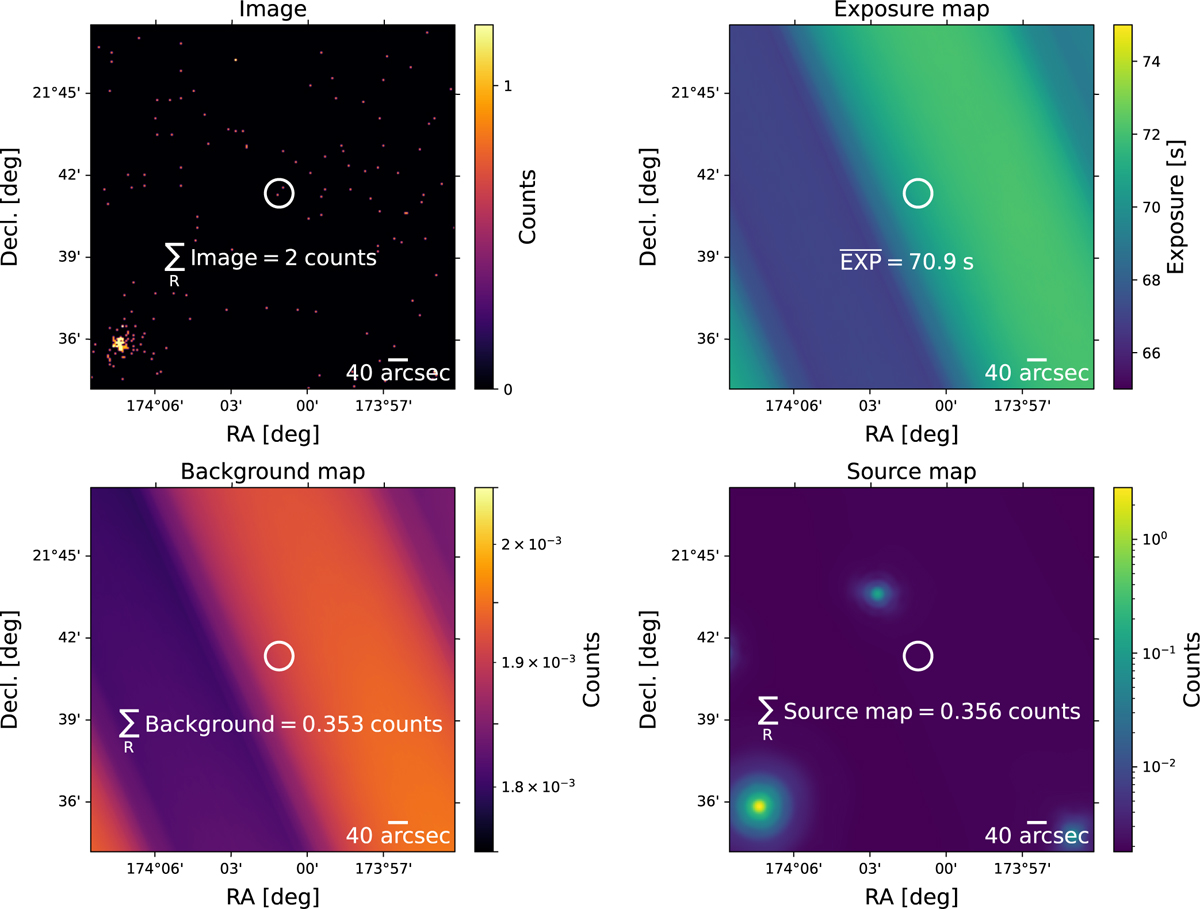
eRASS1 eROSITA data products for the sky tile 174 069 in the 0.2–2.3 keV energy band. Top panels: science image (left) with the discrete observed counts and the exposure time (right) image shows the time, in seconds, that each position in the sky was observed on-axis by eROSITA. Bottom panels: Source-free background map (left) in units of counts per pixel. The source map (right) is produced by the addition of the best PSF-fit model of the detected sources and the source-free background to create a source+background map. In all images, the white circles with a radius of ~30″ represent the size of the aperture obtained from an EEF of 75% of the PSF. The scale bars, shown in the lower right corners of the maps, have an angular size of 40″. We note that the background, exposure time, and source map exhibit diagonal stripes produced by the scanning mode of eROSITA. The color scale of the background and exposure images have been selected to highlight this feature. We emphasize that the difference between the higher and lower values of the exposure time and the background maps lie within ±4% of the mean value.
Current usage metrics show cumulative count of Article Views (full-text article views including HTML views, PDF and ePub downloads, according to the available data) and Abstracts Views on Vision4Press platform.
Data correspond to usage on the plateform after 2015. The current usage metrics is available 48-96 hours after online publication and is updated daily on week days.
Initial download of the metrics may take a while.