Fig. 1
Download original image
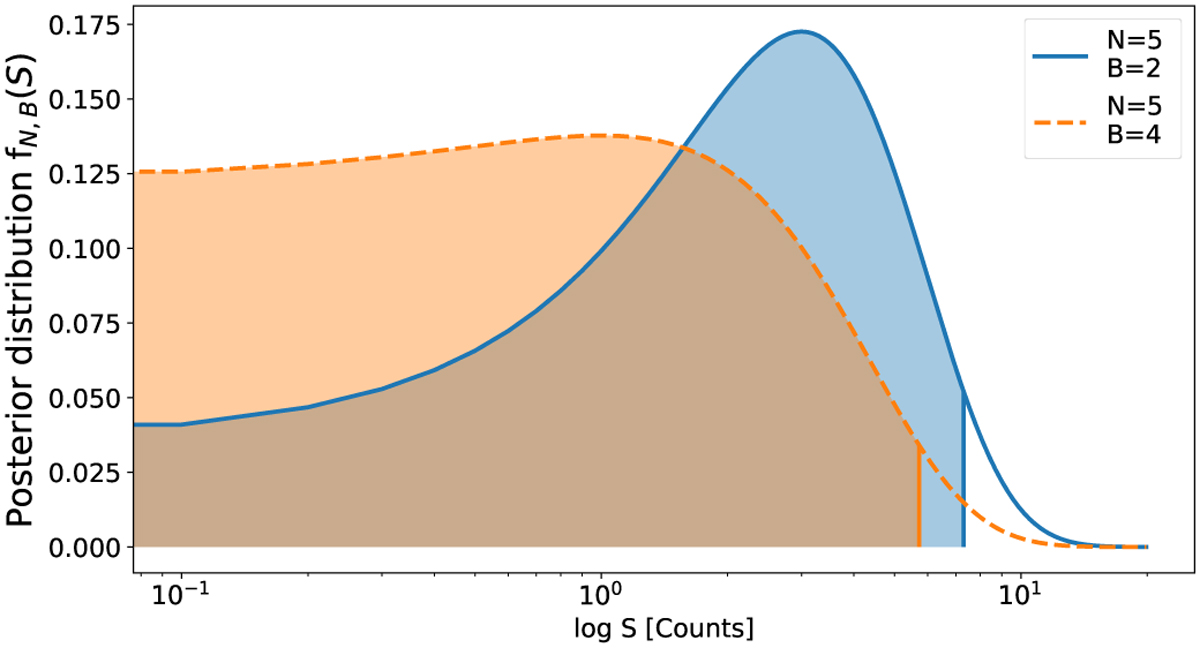
Posterior distribution function from Eq. (2) as a function of log S with a confidence interval of CL = 0.9 (90%). Both curves correspond to the posterior distribution of an X-ray observation with N = 5 observed counts but different background levels of B = 2 (blue solid curve) and B = 4 counts (orange dashed curve). The shaded area under each curve illustrates the cumulative distribution from Eq. (4) up to 90% of the cumulative probability. The vertical lines correspond to the onesided upper limit (UL) calculated from Eq. (5). We find UL5,2 = 7.30 and UL5,4 = 5.72 counts.
Current usage metrics show cumulative count of Article Views (full-text article views including HTML views, PDF and ePub downloads, according to the available data) and Abstracts Views on Vision4Press platform.
Data correspond to usage on the plateform after 2015. The current usage metrics is available 48-96 hours after online publication and is updated daily on week days.
Initial download of the metrics may take a while.