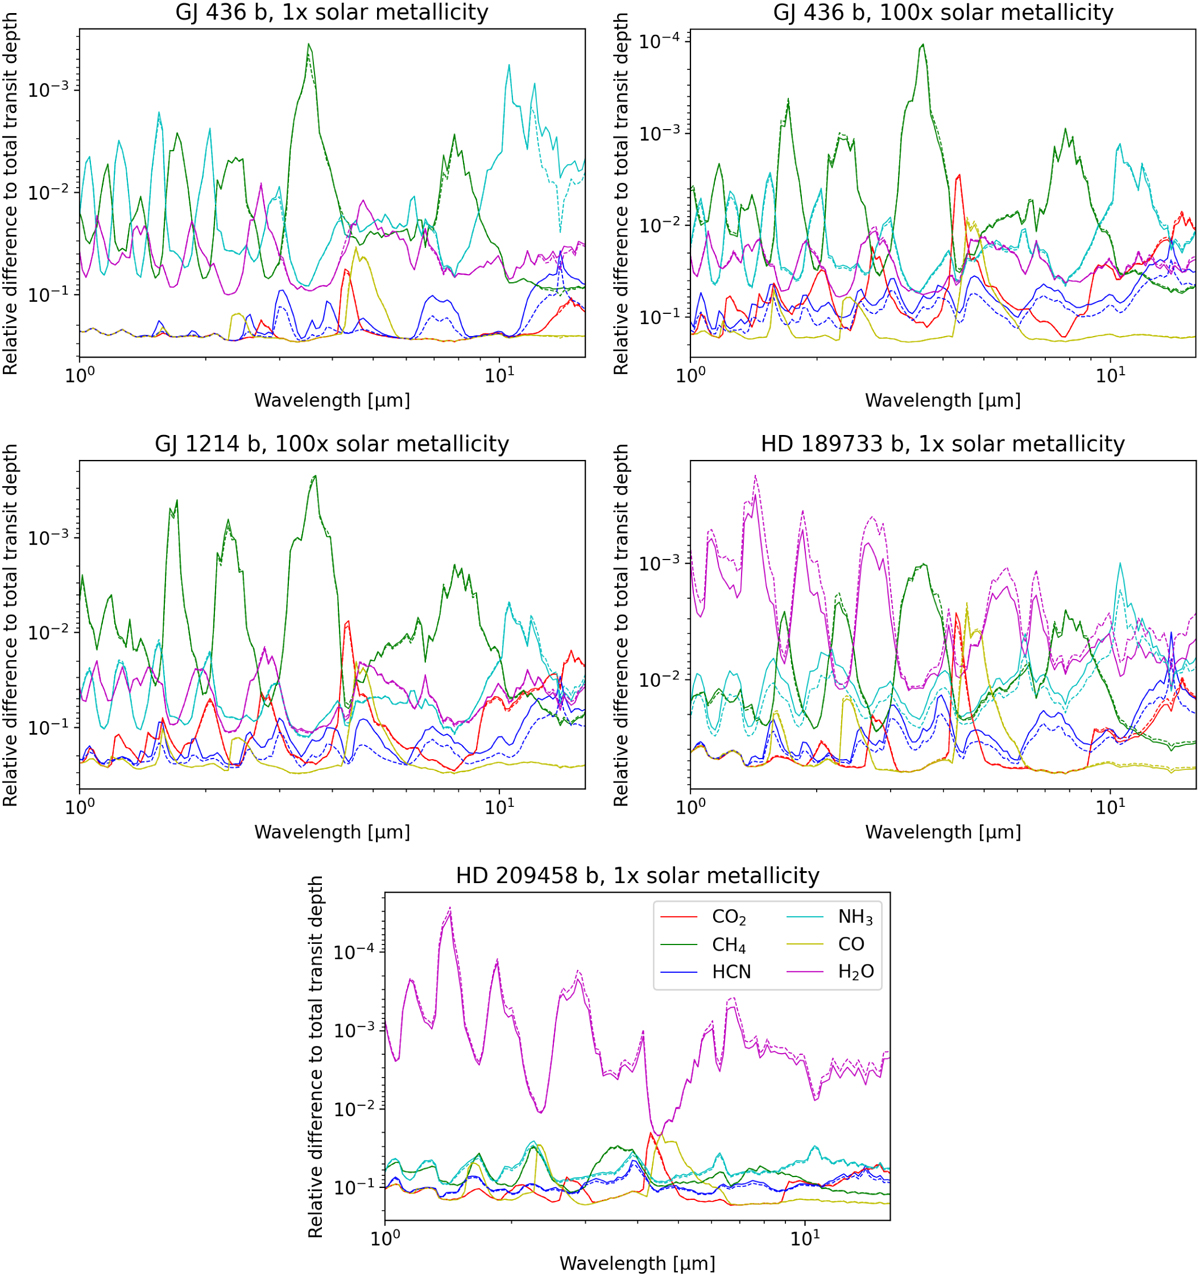
Fig. E.1
Download original image
Contribution to the synthetic transmission spectra for all considered absorbing species. Dashed lines are computed from abundances obtained with V20, and solid lines from abundances obtained with V23. The plotted quantity is the relative difference to the total transit depth, ![]() , with Dtot being the total transit depth and Dspec being the contribution of the species to the total transit depth. For each wavelength, only the uppermost and close lines have significant impact on the spectrum.
, with Dtot being the total transit depth and Dspec being the contribution of the species to the total transit depth. For each wavelength, only the uppermost and close lines have significant impact on the spectrum.
Current usage metrics show cumulative count of Article Views (full-text article views including HTML views, PDF and ePub downloads, according to the available data) and Abstracts Views on Vision4Press platform.
Data correspond to usage on the plateform after 2015. The current usage metrics is available 48-96 hours after online publication and is updated daily on week days.
Initial download of the metrics may take a while.