Open Access
Fig. D.1
Download original image
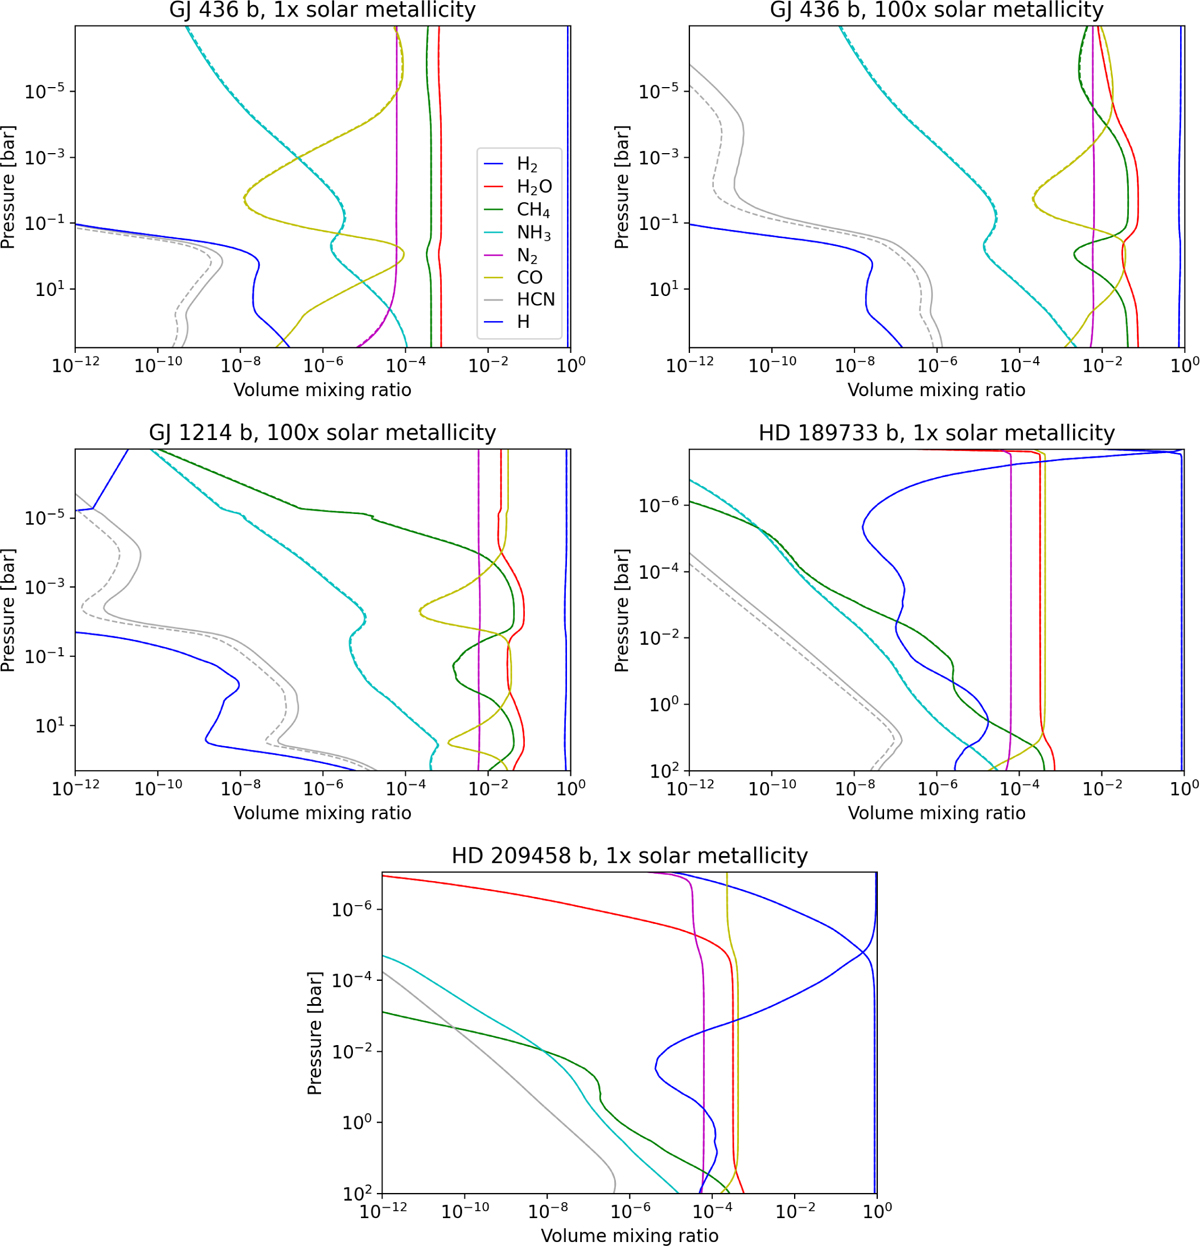
Thermodynamic equilibrium abundance profiles of the main species for all exoplanets cases in Table 3. Dashed lines are computed with the V20 thermodynamic data and solid lines are based on V23 thermodynamic data. In the last panel, all these lines overlap perfectly, indicating no difference for this PT profile.
Current usage metrics show cumulative count of Article Views (full-text article views including HTML views, PDF and ePub downloads, according to the available data) and Abstracts Views on Vision4Press platform.
Data correspond to usage on the plateform after 2015. The current usage metrics is available 48-96 hours after online publication and is updated daily on week days.
Initial download of the metrics may take a while.