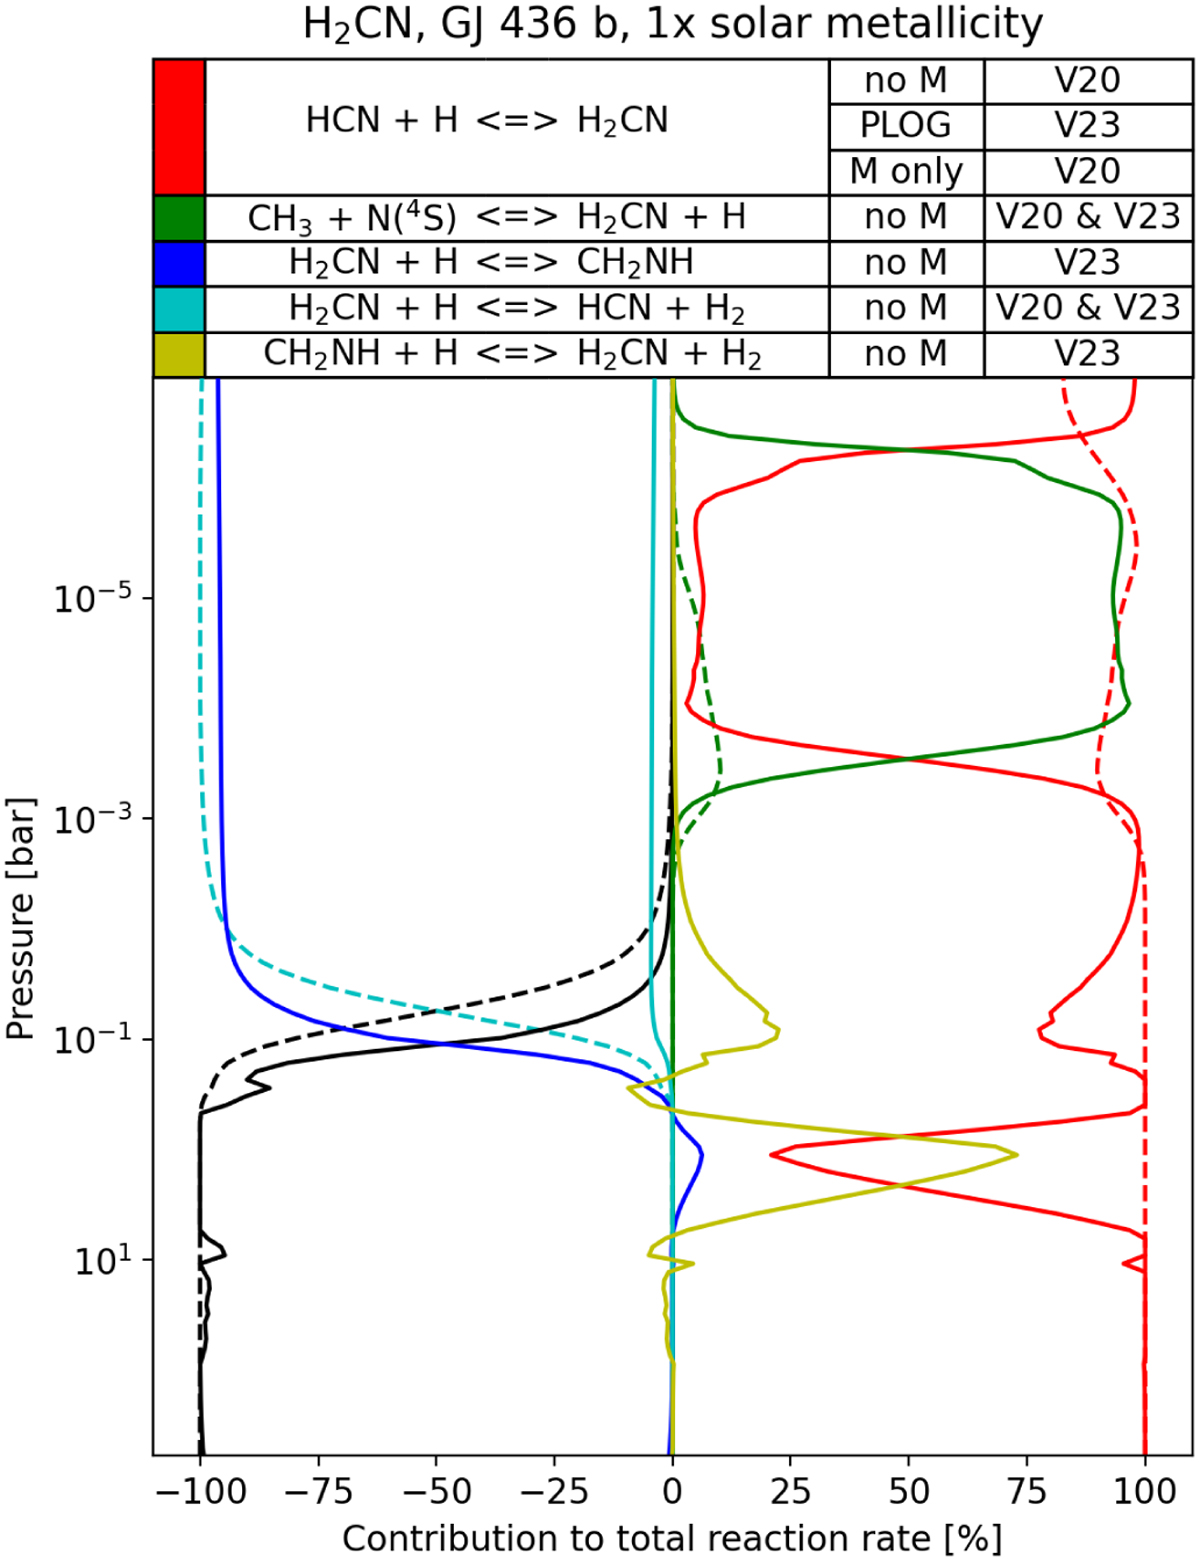
Fig. 12
Download original image
Contribution profile of most major production and loss reactions for H2CN in GJ 436 b. Positive values are production contributions and negative values are loss contributions. Black lines correspond to vertical mixing compensation, such as the sum in each layer is always zero due to steady state. Dashed lines are for V20, while solid lines are for V23. The third column in the legend indicates the reaction type. “no M” corresponds to reactions without pressure dependence, “PLOG” to full pressure dependence and fall off description with PLOG formalism and “M only” to pressure dependence without fall off nor high pressure limit. The last column indicates which model includes this reaction.
Current usage metrics show cumulative count of Article Views (full-text article views including HTML views, PDF and ePub downloads, according to the available data) and Abstracts Views on Vision4Press platform.
Data correspond to usage on the plateform after 2015. The current usage metrics is available 48-96 hours after online publication and is updated daily on week days.
Initial download of the metrics may take a while.