Open Access
Fig. 1
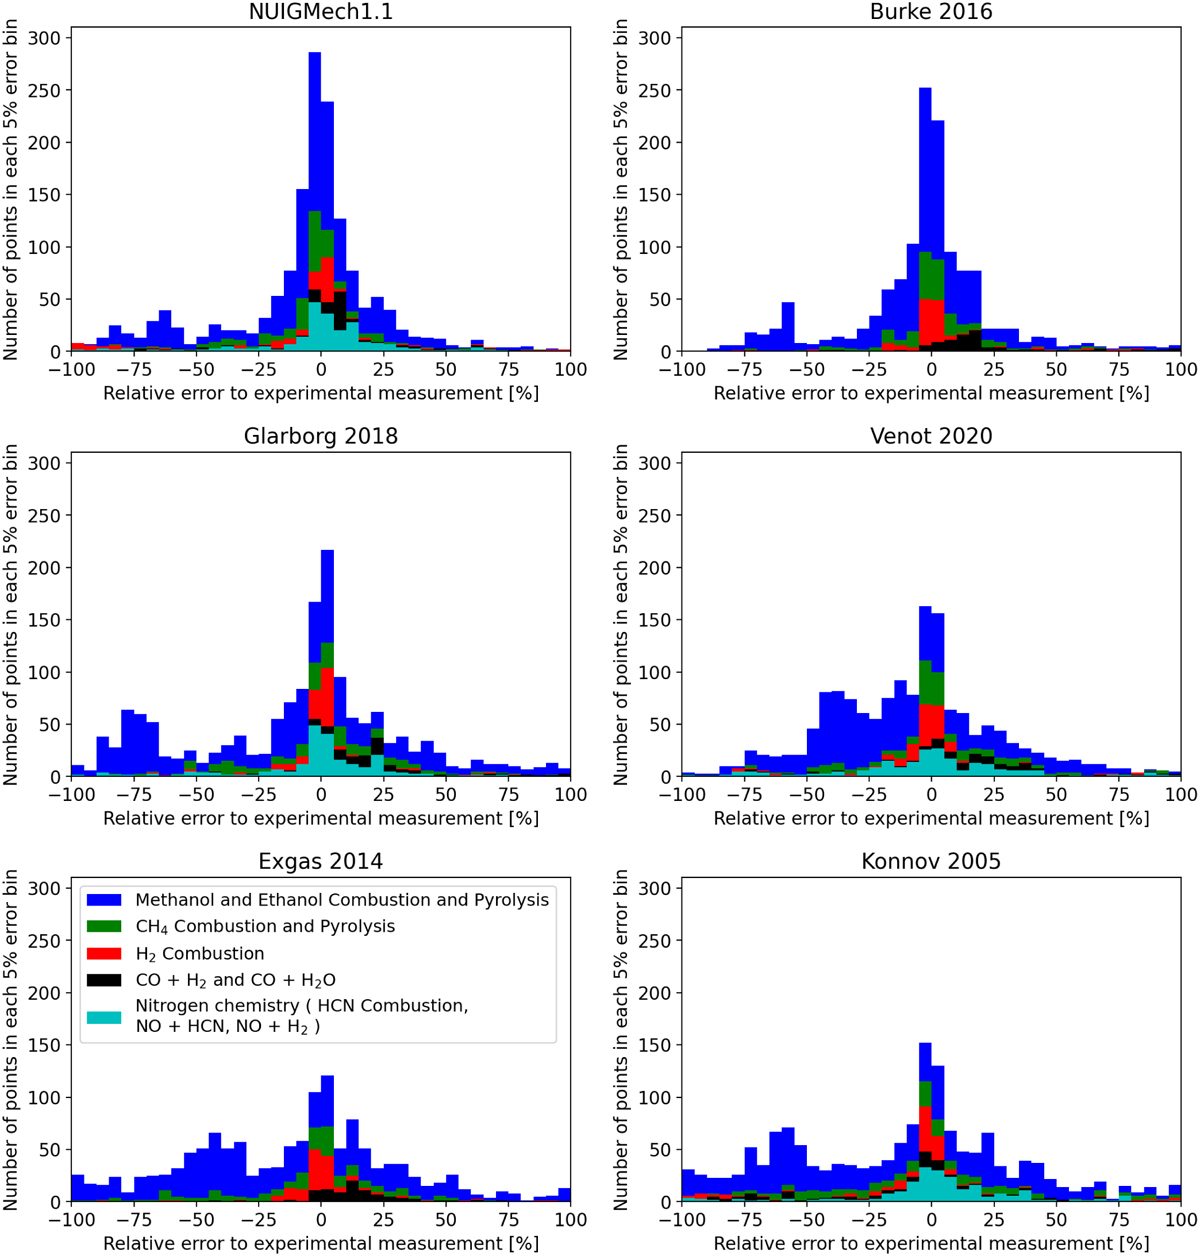
Download original image
Statistical distribution of the relative error over every experimental point in the 1618 points data set for each studied chemical network. Points are grouped in colors corresponding to a different type of initial conditions. AramcoMech3.0 is not shown here as it is almost identical to Burke 2016.
Current usage metrics show cumulative count of Article Views (full-text article views including HTML views, PDF and ePub downloads, according to the available data) and Abstracts Views on Vision4Press platform.
Data correspond to usage on the plateform after 2015. The current usage metrics is available 48-96 hours after online publication and is updated daily on week days.
Initial download of the metrics may take a while.