Fig. 9.
Download original image
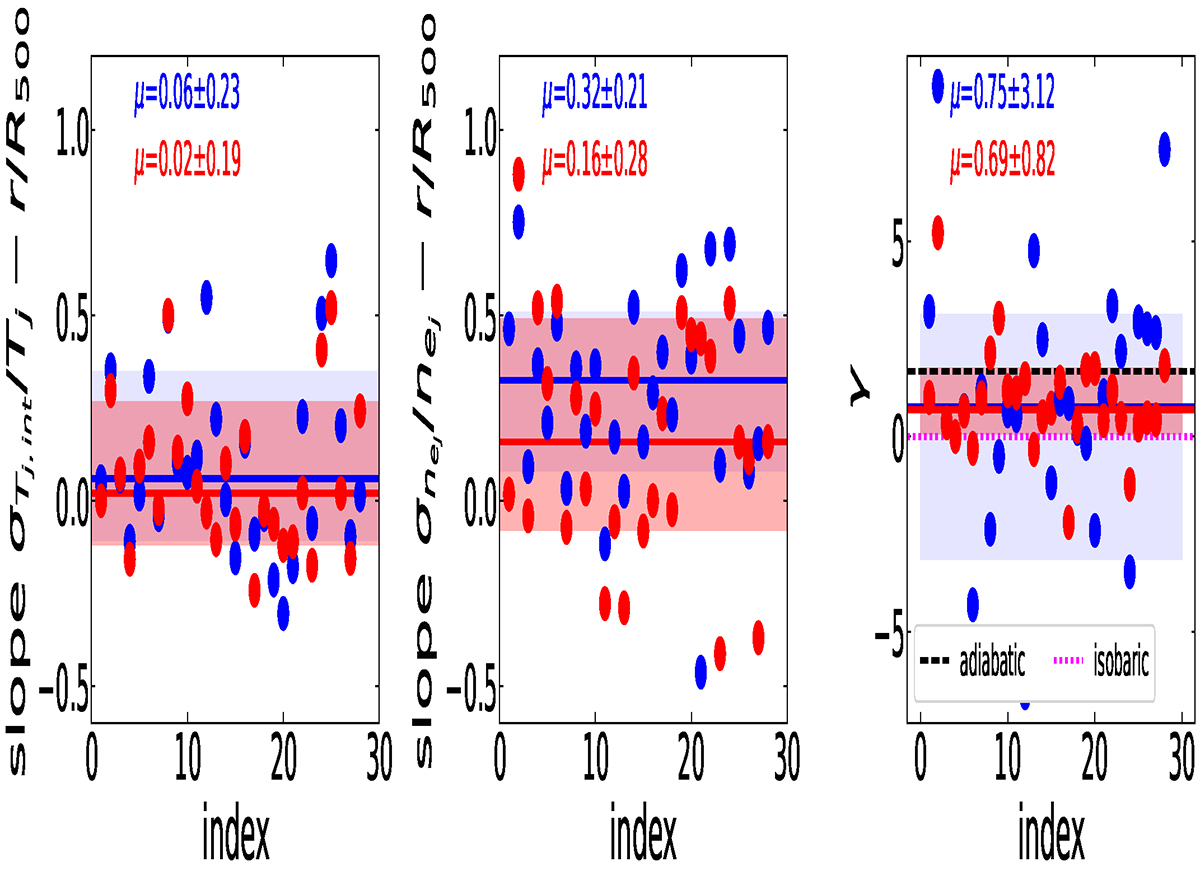
Slope values of the intrinsic scatter of the temperature (left panel) and electron density (middle panel) measured within ∼0.6R500. In the right panel, we show the polytropic index γ (see Eq. (10)) derived for each cluster. Blue points are from maps with S/N = 30 and red points are from maps with S/N = 50. The solid lines represent the median value μ (also reported in red on the top-left corners) while the shaded area includes the 16th and 84th percentiles.
Current usage metrics show cumulative count of Article Views (full-text article views including HTML views, PDF and ePub downloads, according to the available data) and Abstracts Views on Vision4Press platform.
Data correspond to usage on the plateform after 2015. The current usage metrics is available 48-96 hours after online publication and is updated daily on week days.
Initial download of the metrics may take a while.