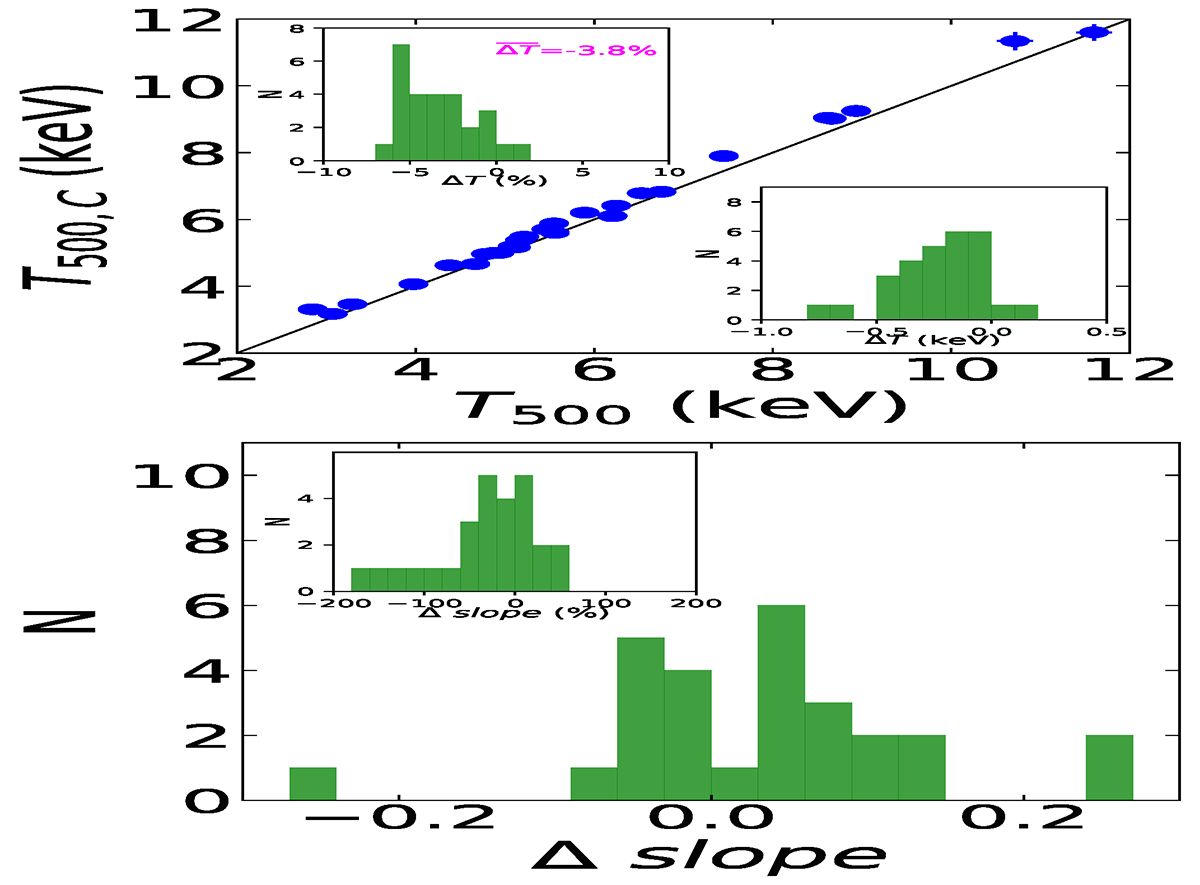
Fig. 8.
Download original image
Impact of the temperature fluctuations to the cluster overall temperature and azimuthal profile. Top: Comparison between the global temperature estimated using all the cells in the 2D maps and the temperature estimated after excluding the cells deviating more than 1σ with respect to the azimuthal value. In the inset plots we show the absolute difference between T500 and T500, c (bottom-right inset) and its fractional variation (top-left inset). Bottom: Change in the gradient of the temperature profile fitted in the region 0.15–0.75R500 before and after the clipping. In the inset plot, we show its fractional variation.
Current usage metrics show cumulative count of Article Views (full-text article views including HTML views, PDF and ePub downloads, according to the available data) and Abstracts Views on Vision4Press platform.
Data correspond to usage on the plateform after 2015. The current usage metrics is available 48-96 hours after online publication and is updated daily on week days.
Initial download of the metrics may take a while.