Fig. 7.
Download original image
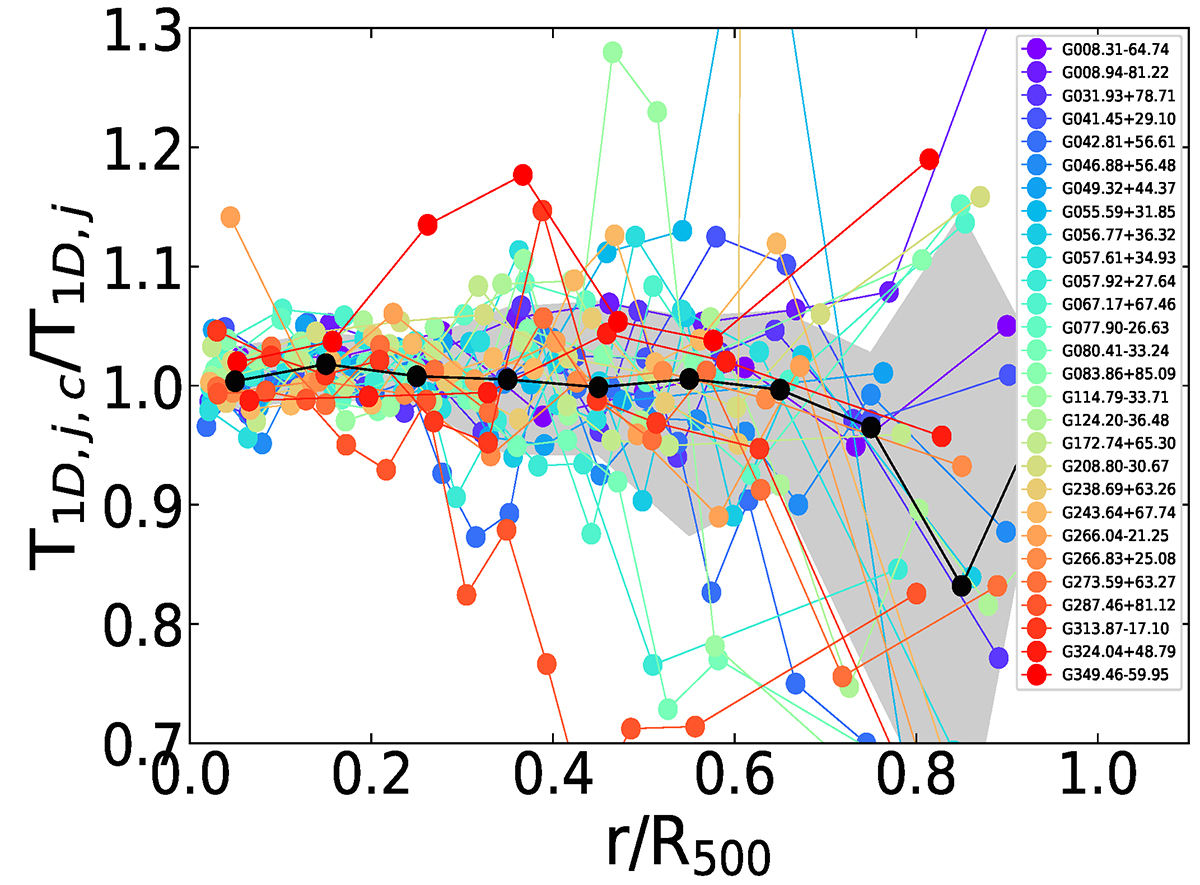
Ratio between T1D, j, c (i.e., the temperature estimated in each annulus j after clipping the most deviating regions) and T1D, j (i.e., the temperature estimated using all the temperature cells in each annulus) as a function of radius. The black points represents the average values, while the shadow area includes the 16th and 84th percentiles.
Current usage metrics show cumulative count of Article Views (full-text article views including HTML views, PDF and ePub downloads, according to the available data) and Abstracts Views on Vision4Press platform.
Data correspond to usage on the plateform after 2015. The current usage metrics is available 48-96 hours after online publication and is updated daily on week days.
Initial download of the metrics may take a while.