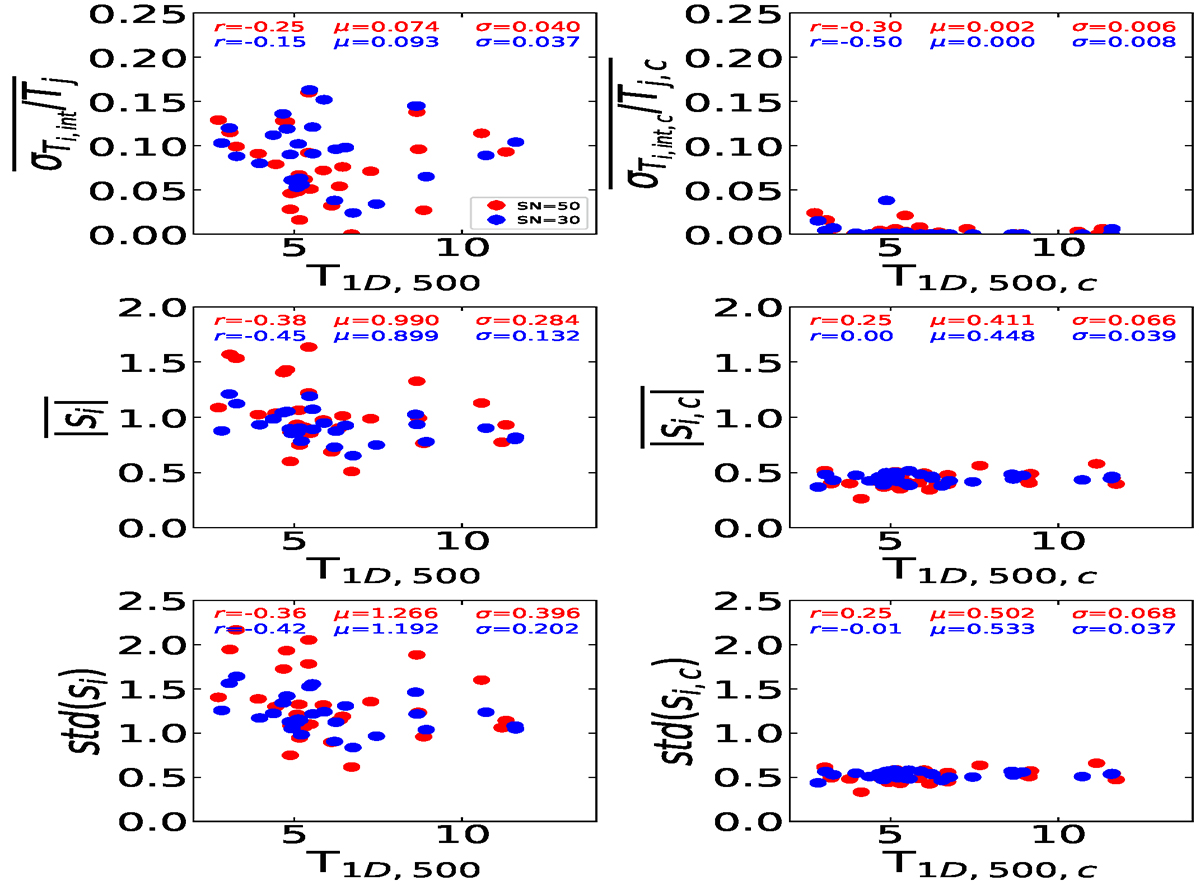
Fig. 6.
Download original image
Spectral parameters derived before (left panels) and after (right panels) clipping for the regions deviating more than 1σ from the azimuthal values. In blue and red we show the results obtained with maps of S/N = 30 and S/N = 50, respectively. In each panel we provide the correlation (i.e., Spearman rank test value r) between the spectral parameter and T, the median value of the distribution μ, and the standard deviation σ.
Current usage metrics show cumulative count of Article Views (full-text article views including HTML views, PDF and ePub downloads, according to the available data) and Abstracts Views on Vision4Press platform.
Data correspond to usage on the plateform after 2015. The current usage metrics is available 48-96 hours after online publication and is updated daily on week days.
Initial download of the metrics may take a while.