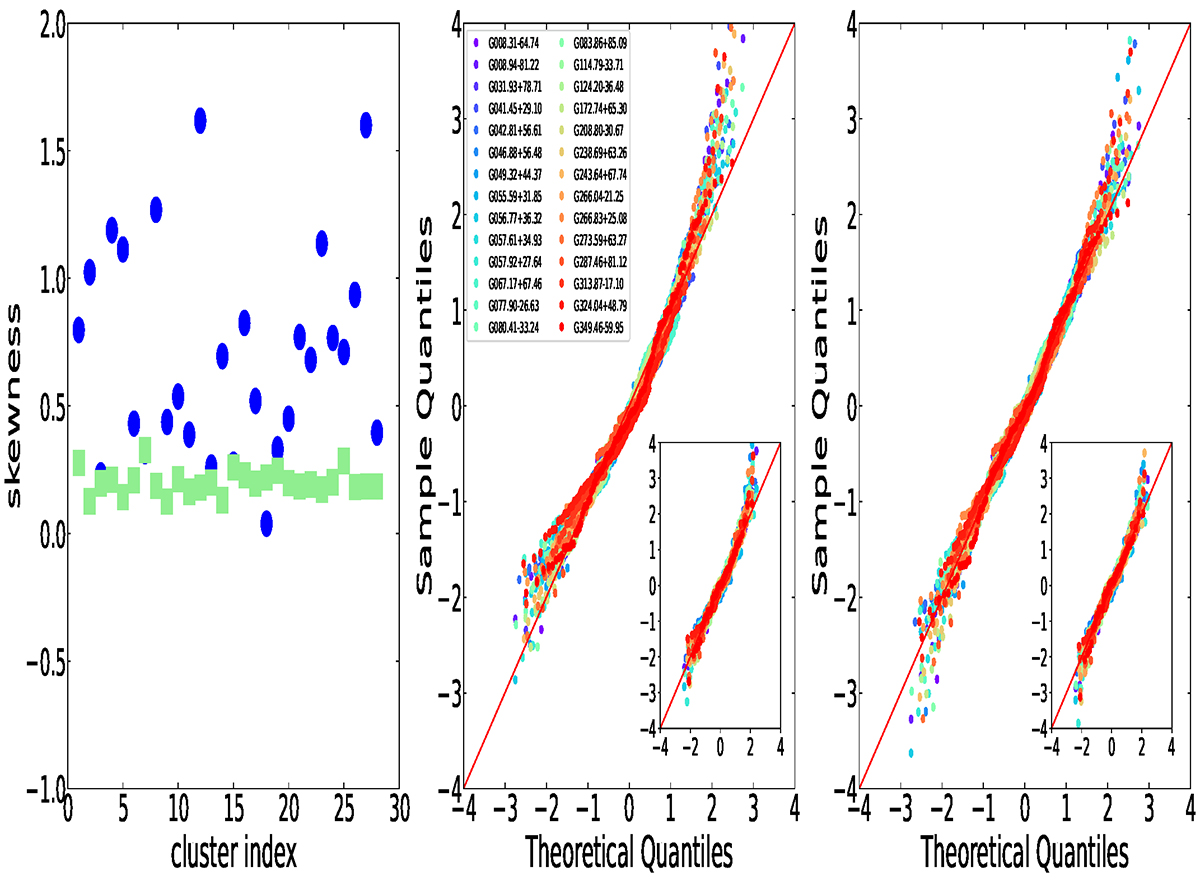
Fig. 5.
Download original image
Observed properties of the 2D temperature distribution. Left: Measured values (blue circles) of the skewness in the temperature distribution of T2D, i/T2D, j (being T2D, j the temperature of the annulus encompassing the cell i) compared with a typical uncertainty (green squares) that can be associated with the number of cells on the temperature map. Middle: QQ plot, assuming a normal distribution, of the T2D, i/T1D, j values for the maps with S/N = 30. Right: QQ plot assuming a log-normal distribution. In the inset plots, we show the results when using the maps with S/N = 50. The units of the QQ plots are given in z-score (i.e., subtracting the mean from each data point and dividing it by the standard deviation).
Current usage metrics show cumulative count of Article Views (full-text article views including HTML views, PDF and ePub downloads, according to the available data) and Abstracts Views on Vision4Press platform.
Data correspond to usage on the plateform after 2015. The current usage metrics is available 48-96 hours after online publication and is updated daily on week days.
Initial download of the metrics may take a while.