Open Access
Fig. 4.
Download original image
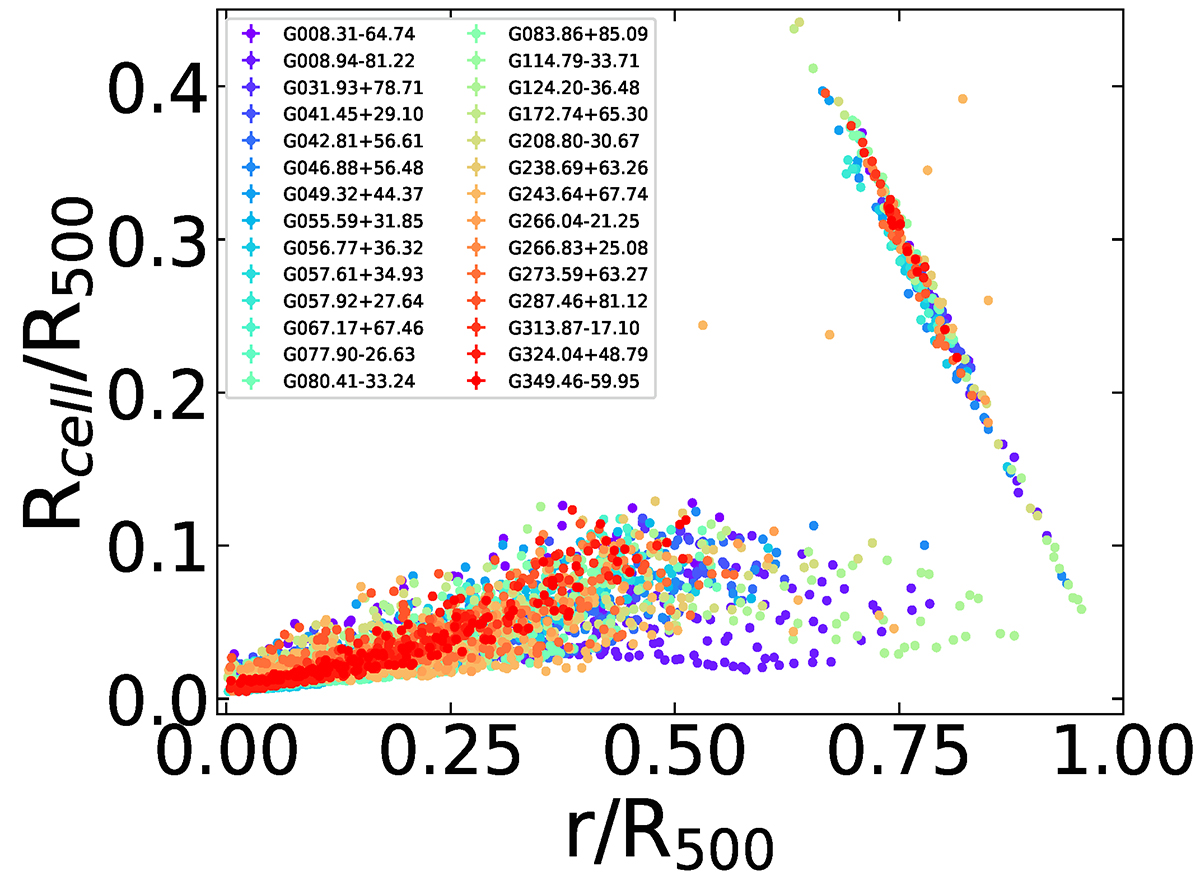
Radius of the cells for the maps obtained with S/N = 30, in fraction of R500, as a function of the distance from the center. The feature observed at r/R500 ⪆ 0.65 is the result of the large cell sizes in the outer regions.
Current usage metrics show cumulative count of Article Views (full-text article views including HTML views, PDF and ePub downloads, according to the available data) and Abstracts Views on Vision4Press platform.
Data correspond to usage on the plateform after 2015. The current usage metrics is available 48-96 hours after online publication and is updated daily on week days.
Initial download of the metrics may take a while.