Fig. E.1.
Download original image
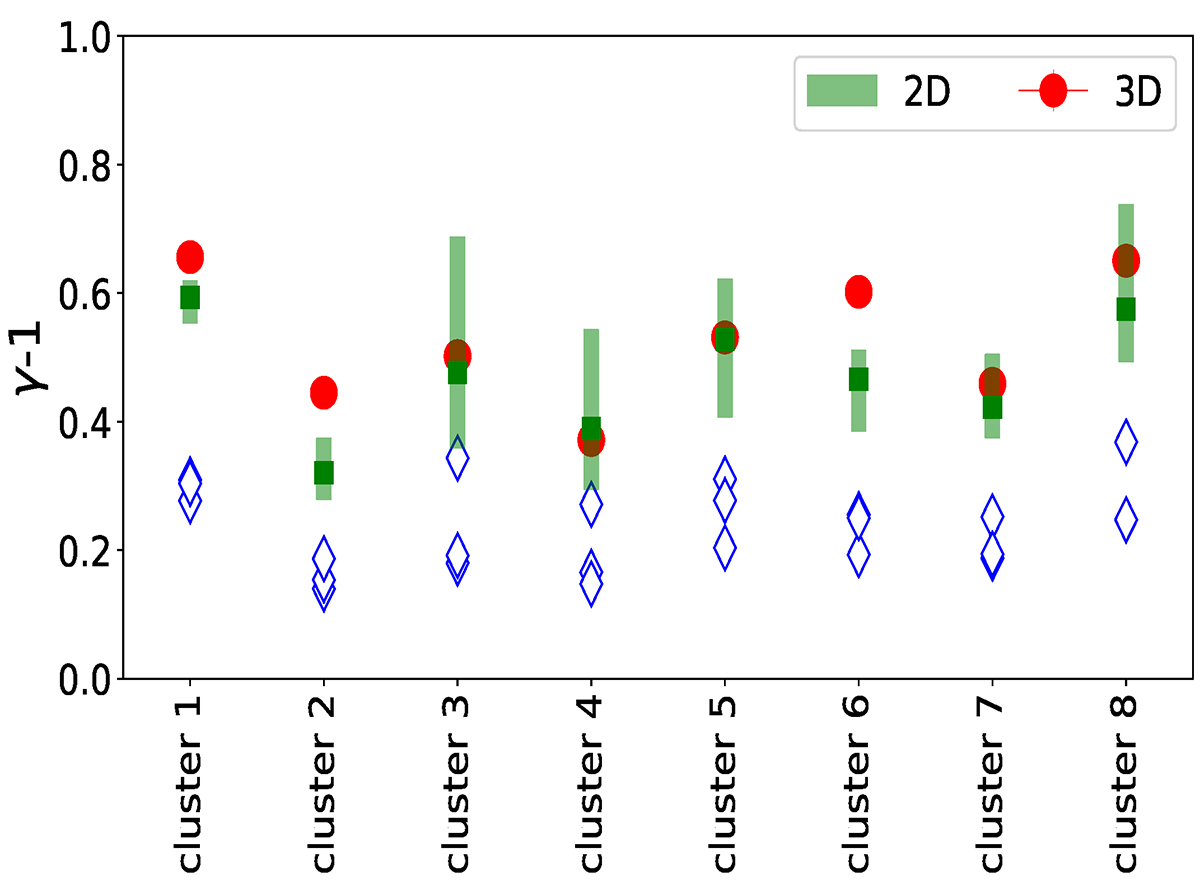
For each of the 8 simulated clusters, we show the mean ratio between the radial values of δT3D/T3D and δn/n (red points), δT2D/T2D and ![]() in three different projections (blue diamonds), and the latter values corrected by the factor of 2 from Schuecker et al. (2004; the green squares represent the average values while the error bars represent the minimum and maximum values from the different projections).
in three different projections (blue diamonds), and the latter values corrected by the factor of 2 from Schuecker et al. (2004; the green squares represent the average values while the error bars represent the minimum and maximum values from the different projections).
Current usage metrics show cumulative count of Article Views (full-text article views including HTML views, PDF and ePub downloads, according to the available data) and Abstracts Views on Vision4Press platform.
Data correspond to usage on the plateform after 2015. The current usage metrics is available 48-96 hours after online publication and is updated daily on week days.
Initial download of the metrics may take a while.