Open Access
Fig. D.2.
Download original image
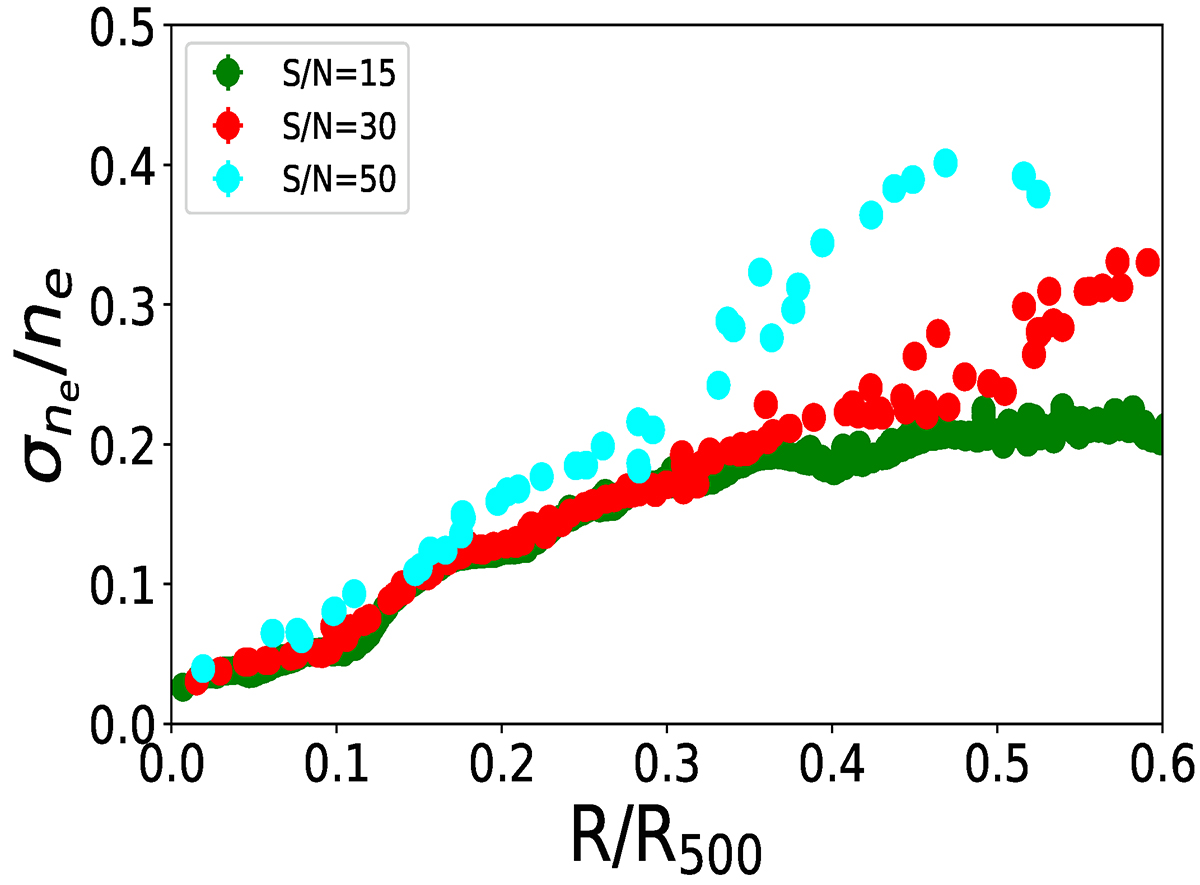
Impact of the map resolution on the density profile in the case of G041.45+29.10. We truncate the plot at 0.6R500 because beyond that radius we have a poor resolution (in particular with S/N=50). Each point represents the value of σne/ne computed at the radius of the cells in the map.
Current usage metrics show cumulative count of Article Views (full-text article views including HTML views, PDF and ePub downloads, according to the available data) and Abstracts Views on Vision4Press platform.
Data correspond to usage on the plateform after 2015. The current usage metrics is available 48-96 hours after online publication and is updated daily on week days.
Initial download of the metrics may take a while.