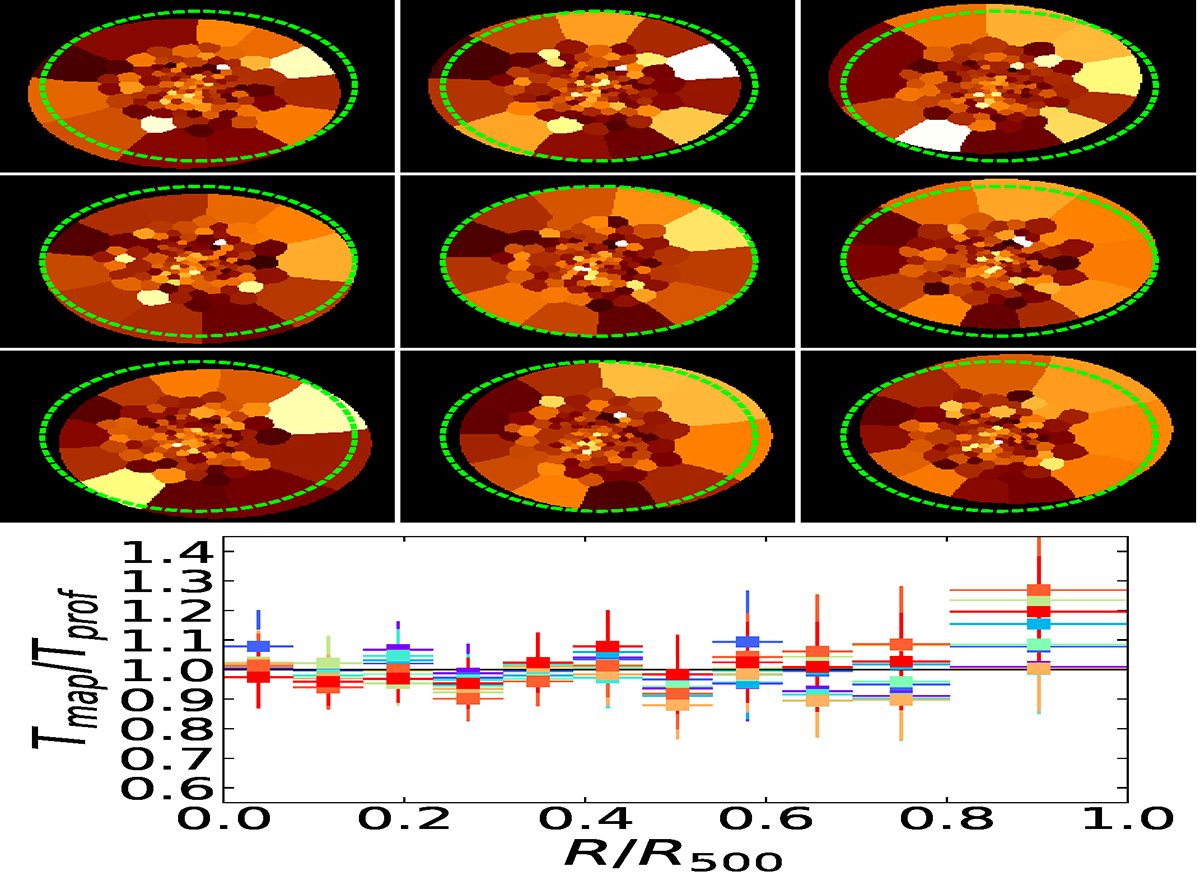
Fig. D.1.
Download original image
Impact of the Voronoi tessellation on the 2D temperature distribution. Top: temperature maps obtained for G041.45+29.10 by offsetting the center of the map wrt to the X-ray peak. The green circles identify R500 centered on the peak. Bottom: ratio between the temperature recovered from the nine maps (using Eq. 2) and the temperature estimated using the spectra extracted from azimuthal annuli. Each color (from blue to red) represents one of the maps in the top panel (from top-left to bottom-right).
Current usage metrics show cumulative count of Article Views (full-text article views including HTML views, PDF and ePub downloads, according to the available data) and Abstracts Views on Vision4Press platform.
Data correspond to usage on the plateform after 2015. The current usage metrics is available 48-96 hours after online publication and is updated daily on week days.
Initial download of the metrics may take a while.