Fig. 2.
Download original image
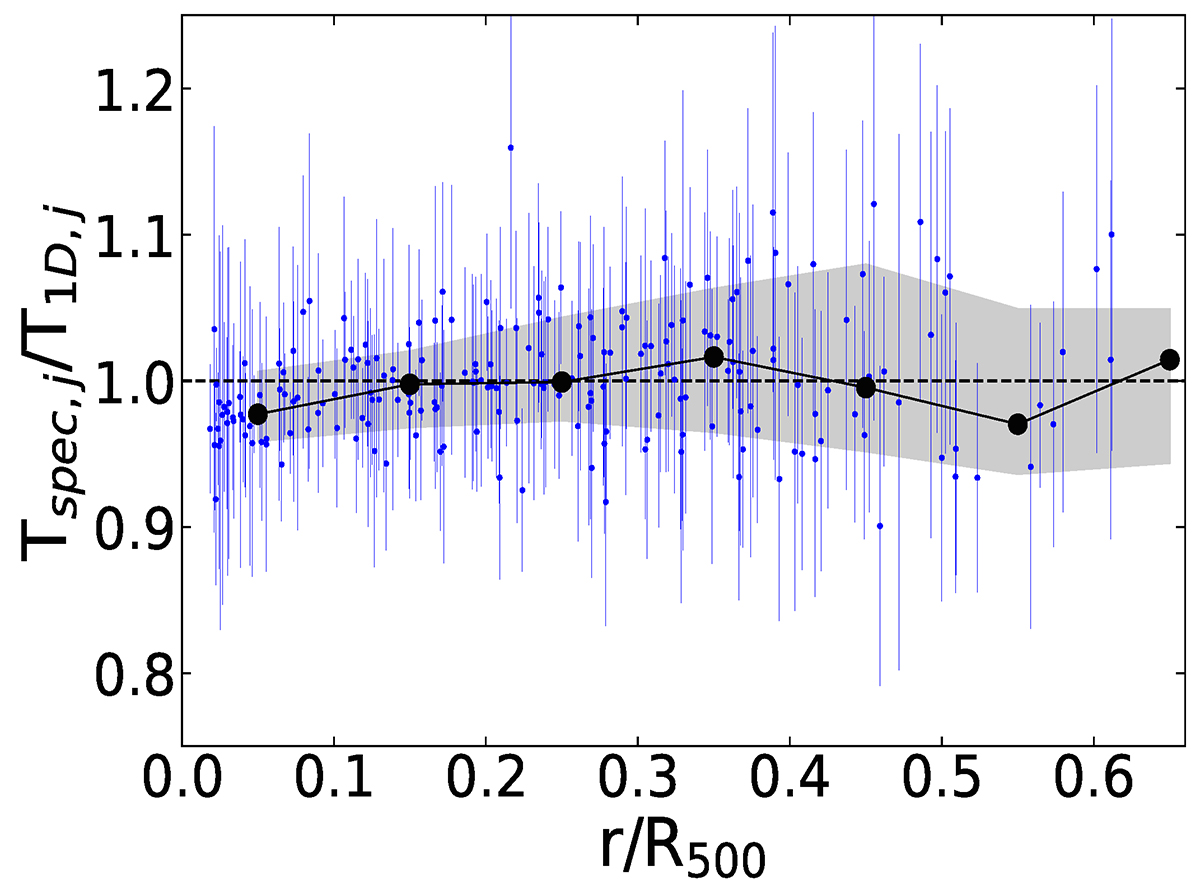
Comparison between the profile derived with the direct spectral fitting of each annulus j (i.e., Tspec, j). and the temperatures recovered from the maps using Eq. (2) (i.e., T1D, j) in the same spatial regions. Each blue point corresponds to an annulus of the 28 clusters, while the black points represents the average values with the shadow area including the 16th and 84th percentiles.
Current usage metrics show cumulative count of Article Views (full-text article views including HTML views, PDF and ePub downloads, according to the available data) and Abstracts Views on Vision4Press platform.
Data correspond to usage on the plateform after 2015. The current usage metrics is available 48-96 hours after online publication and is updated daily on week days.
Initial download of the metrics may take a while.