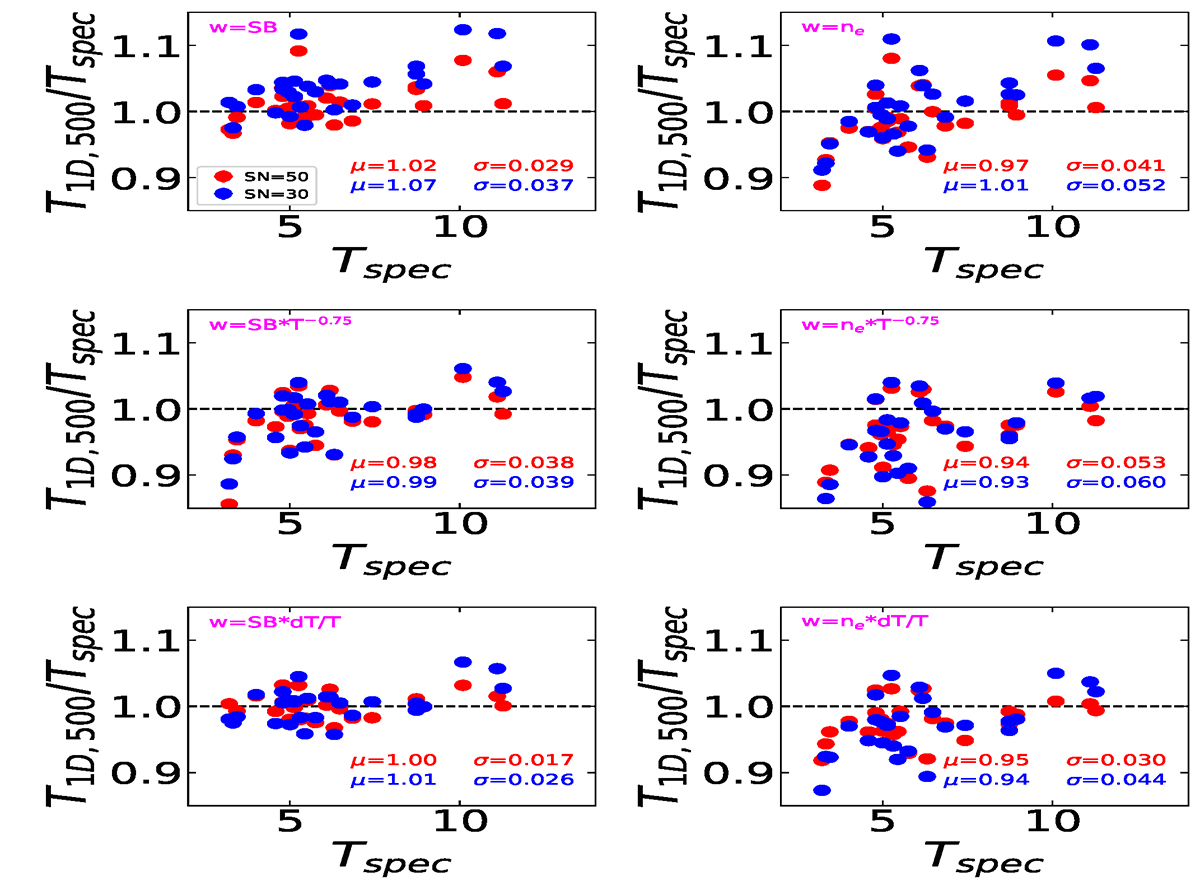
Fig. C.1.
Download original image
Comparison between the temperature derived from the maps (i.e., T1D, 500) and the global temperature (i.e., Tspec) obtained by fitting a single spectrum extracted within R500. In each subplot the text in magenta indicates the weighting used to recover T1D, 500 from the maps, while the values of μ and σ indicate the median of the distribution and its dispersion. In blue we show the results using the maps obtained with S/N=30 while in red we show the ones obtained with S/N=50.
Current usage metrics show cumulative count of Article Views (full-text article views including HTML views, PDF and ePub downloads, according to the available data) and Abstracts Views on Vision4Press platform.
Data correspond to usage on the plateform after 2015. The current usage metrics is available 48-96 hours after online publication and is updated daily on week days.
Initial download of the metrics may take a while.