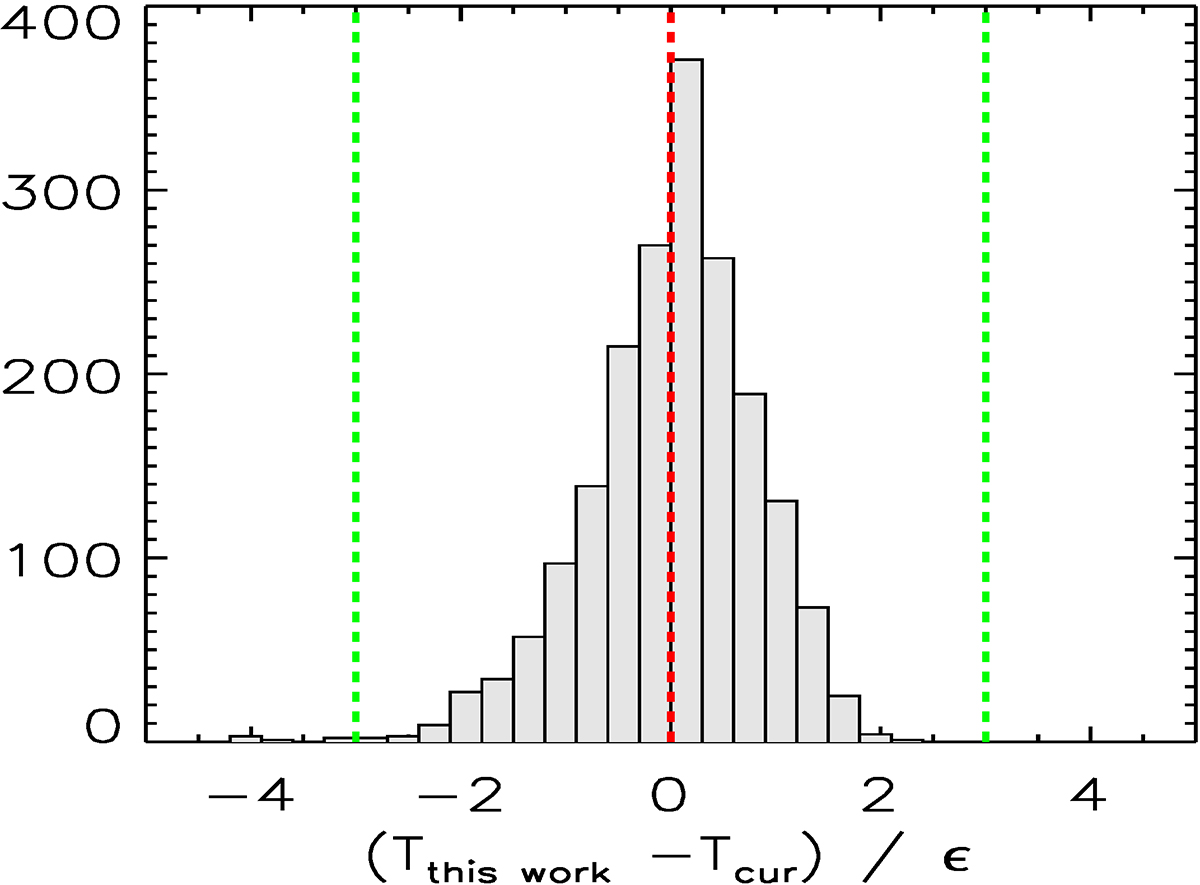
Fig. B.1.
Download original image
Comparison of the temperatures measured in the maps reconstructed in this work and the ones obtained from the curvelet technique. The histogram represents the distribution of the difference in spectroscopic measurements normalized to the statistical error ![]() for 1,916 spatial cells obtained in 10 objects. The vertical dashed lines indicate 0 (red) and -3, 3 (green).
for 1,916 spatial cells obtained in 10 objects. The vertical dashed lines indicate 0 (red) and -3, 3 (green).
Current usage metrics show cumulative count of Article Views (full-text article views including HTML views, PDF and ePub downloads, according to the available data) and Abstracts Views on Vision4Press platform.
Data correspond to usage on the plateform after 2015. The current usage metrics is available 48-96 hours after online publication and is updated daily on week days.
Initial download of the metrics may take a while.