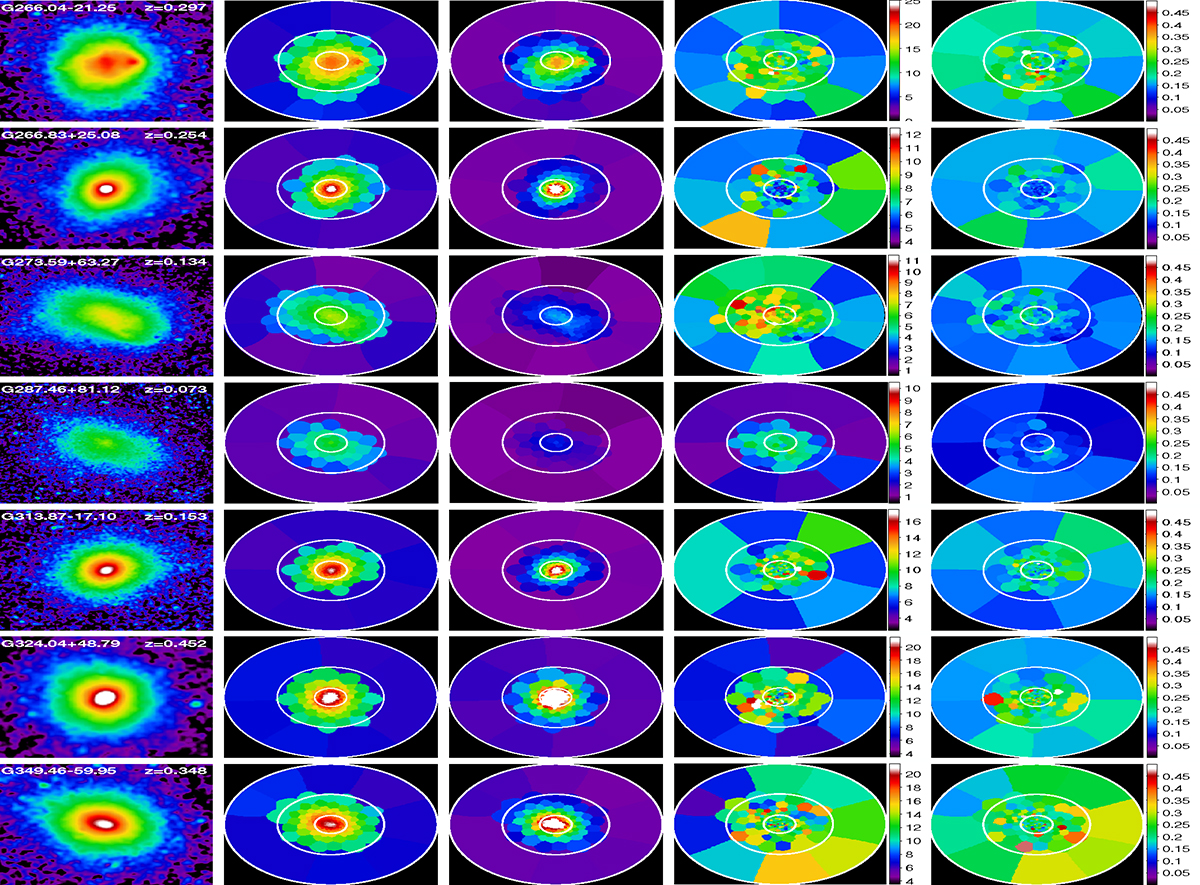
Fig. A.4.
Download original image
From left to right: (a) bkg-subctracted and exposure-corrected images in the 0.3-7 keV band; The size of the boxes corresponds to R500; (b) binned surface brightness maps; (c) projected electron density maps (d) projected temperature maps; (e) relative temperature error maps. The white circles in the voronoi maps corresponds to 0.15R500, 0.5R500, and R500.
Current usage metrics show cumulative count of Article Views (full-text article views including HTML views, PDF and ePub downloads, according to the available data) and Abstracts Views on Vision4Press platform.
Data correspond to usage on the plateform after 2015. The current usage metrics is available 48-96 hours after online publication and is updated daily on week days.
Initial download of the metrics may take a while.