Fig. 13.
Download original image
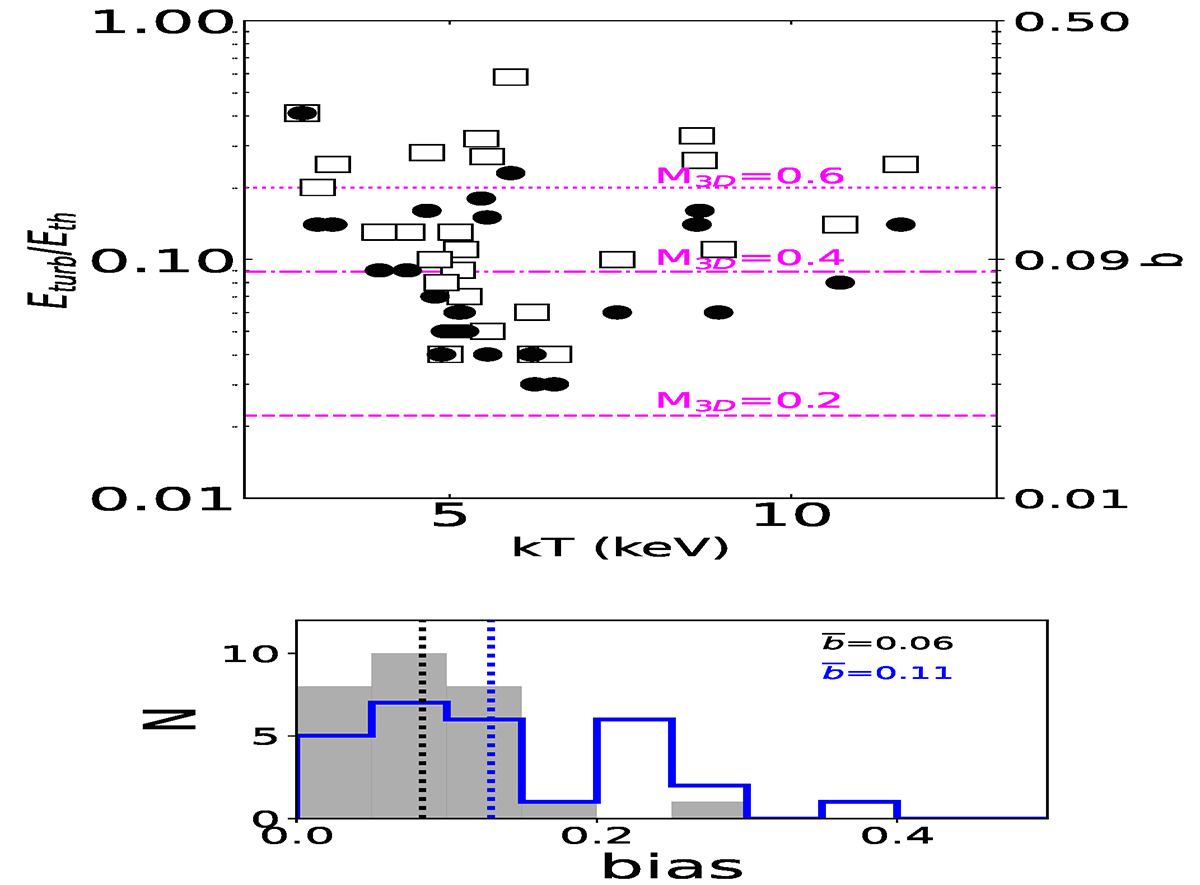
Mass bias and ratio between turbulent and thermal energy in the clusters in our sample. Top: Ratio between the turbulent and the thermal energy computed based on the σT, int/T values and under the assumption that the isobaric fluctuations are dominant. The dashed horizontal lines are computed for different Mach numbers using the following equation: ![]() . In the right y-axis, we provide the mass bias b estimated within R500 through Eq. (14). The empty squares indicate the values of Eturb/Eth (and b) after the correction accounting for the underlying power spectrum (see the text for more details). Bottom: Distribution of the values of the hydrostatic bias. In gray (blue), we show the b values before (after) accounting for the integration of the power spectrum between some characteristic scales (see text in Sect. 4.3). Dotted lines indicate the means of the distributions.
. In the right y-axis, we provide the mass bias b estimated within R500 through Eq. (14). The empty squares indicate the values of Eturb/Eth (and b) after the correction accounting for the underlying power spectrum (see the text for more details). Bottom: Distribution of the values of the hydrostatic bias. In gray (blue), we show the b values before (after) accounting for the integration of the power spectrum between some characteristic scales (see text in Sect. 4.3). Dotted lines indicate the means of the distributions.
Current usage metrics show cumulative count of Article Views (full-text article views including HTML views, PDF and ePub downloads, according to the available data) and Abstracts Views on Vision4Press platform.
Data correspond to usage on the plateform after 2015. The current usage metrics is available 48-96 hours after online publication and is updated daily on week days.
Initial download of the metrics may take a while.