Fig. 12.
Download original image
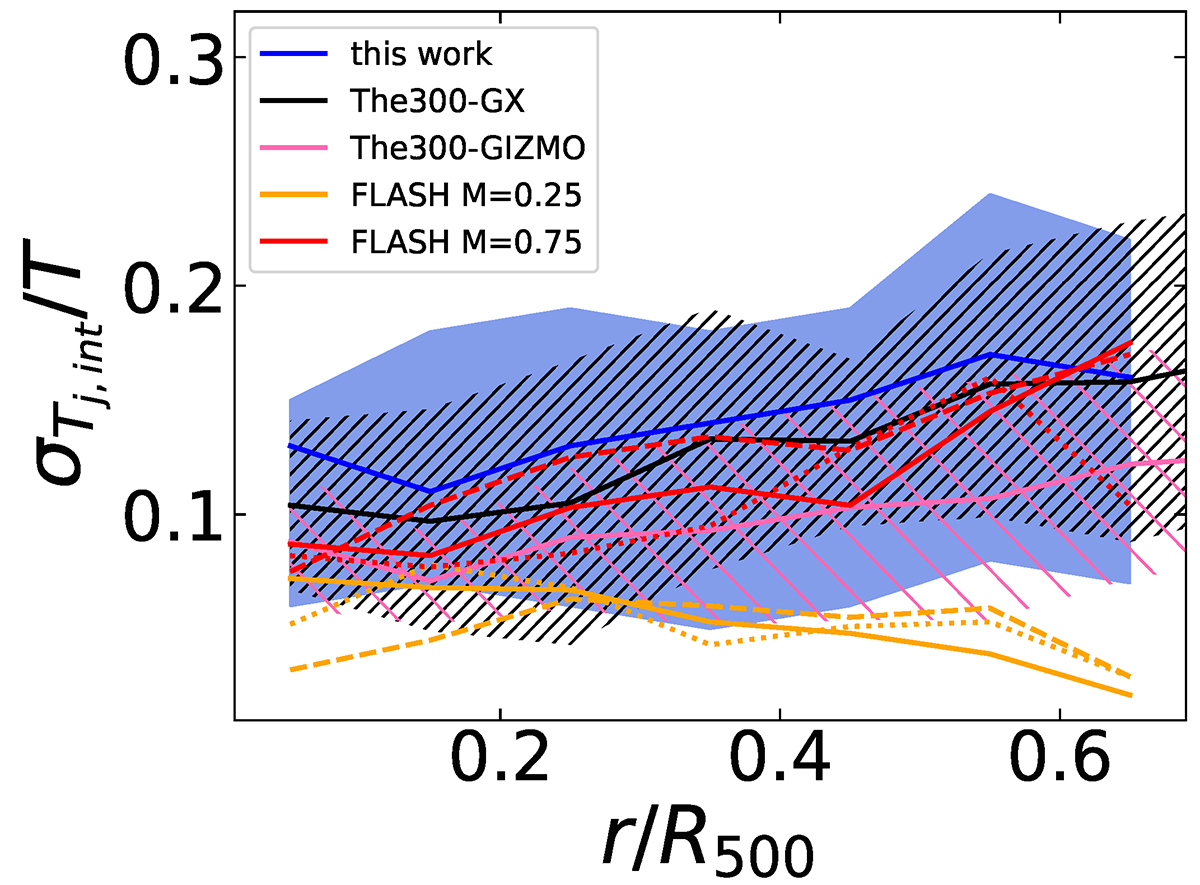
Comparison of σTj, int/T estimated in cells of 0.1R500 as a function of radius between the CHEX-MATE objects (blue; the 16th and 84th percentiles were computed excluding the annuli for which the statistical errors prevents a proper determination of the intrinsic scatter) and results extracted from various hydrodynamical simulations (see text for details in Sect. 4.1). For cosmological simulations (i.e., The 300 GX and GIZMO), we represent the distribution for 45 objects with the median and a dispersion equal to the inter-quartile range divided by 1.35. For the FLASH simulations, we present the results obtained for 3 different projections (with different line styles) of the same object simulated with two different levels of turbulence (i.e., different Mach).
Current usage metrics show cumulative count of Article Views (full-text article views including HTML views, PDF and ePub downloads, according to the available data) and Abstracts Views on Vision4Press platform.
Data correspond to usage on the plateform after 2015. The current usage metrics is available 48-96 hours after online publication and is updated daily on week days.
Initial download of the metrics may take a while.