Open Access
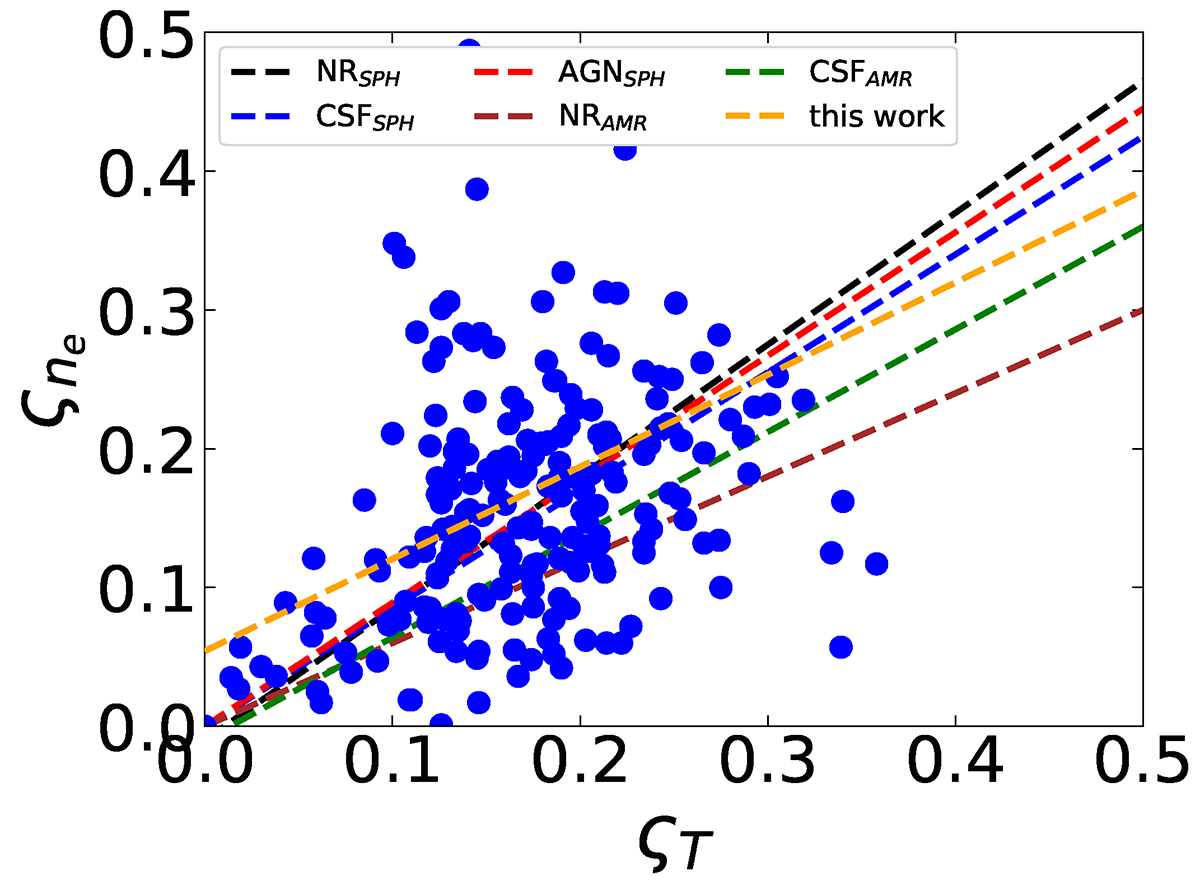
Fig. 11.
Download original image
Correlation between Gaussian standard deviations ςT and ςne measured in different radial shells. Each data point corresponds to the values from a single shell of a cluster. The orange line represents the best-fit relation of the data points and is compared with the best-fits obtained by Rasia et al. (2014).
Current usage metrics show cumulative count of Article Views (full-text article views including HTML views, PDF and ePub downloads, according to the available data) and Abstracts Views on Vision4Press platform.
Data correspond to usage on the plateform after 2015. The current usage metrics is available 48-96 hours after online publication and is updated daily on week days.
Initial download of the metrics may take a while.