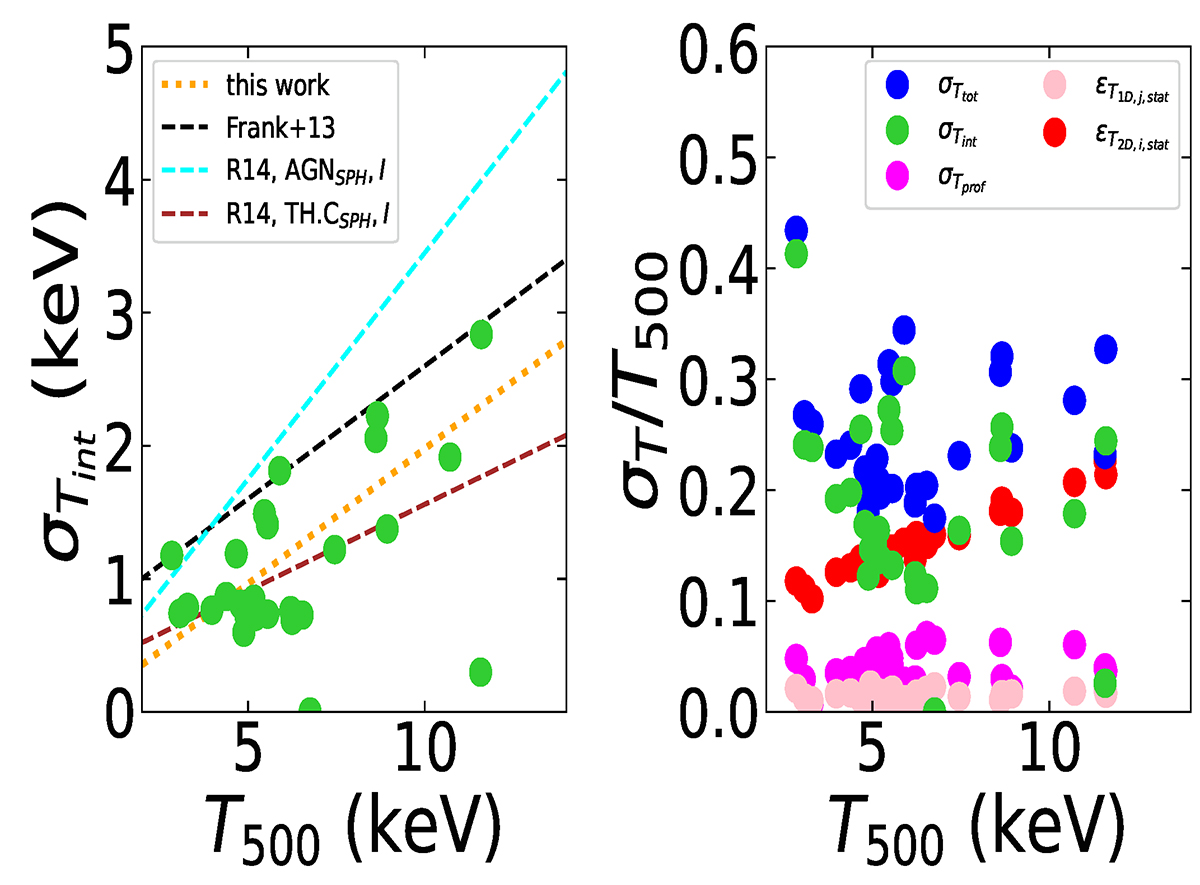
Fig. 10.
Download original image
Total temperature dispersion within R500 as a function of the overall cluster temperature. Left: Relation between the mean cluster temperature T500 and the intrinsic scatter σTint within R500. The dotted orange line represents the best-fit relation to the measured points and is compared to the observations by Frank et al. (2013; black) and simulations with (green) and without (cyan) thermal conduction by Rasia et al. (2014). Right: Relative scatter as function of the cluster temperature. In blue, we show the observed values (i.e., total scatter σTtot/T500), in green we plot the relative intrinsic scatter (i.e., σTint/T500) computed as given in Eq. (13) where the statistical errors (i.e., ϵT1D, j, stat) are shown in pink and are computed using Eq. (4), in magenta we show the scatter associated with the underlying temperature profile (i.e., σTprof/T500), and in red the average statistical uncertainty of the T2D, i measurements (i.e., ϵT2D, i, stat).
Current usage metrics show cumulative count of Article Views (full-text article views including HTML views, PDF and ePub downloads, according to the available data) and Abstracts Views on Vision4Press platform.
Data correspond to usage on the plateform after 2015. The current usage metrics is available 48-96 hours after online publication and is updated daily on week days.
Initial download of the metrics may take a while.