Open Access
Fig. 1.
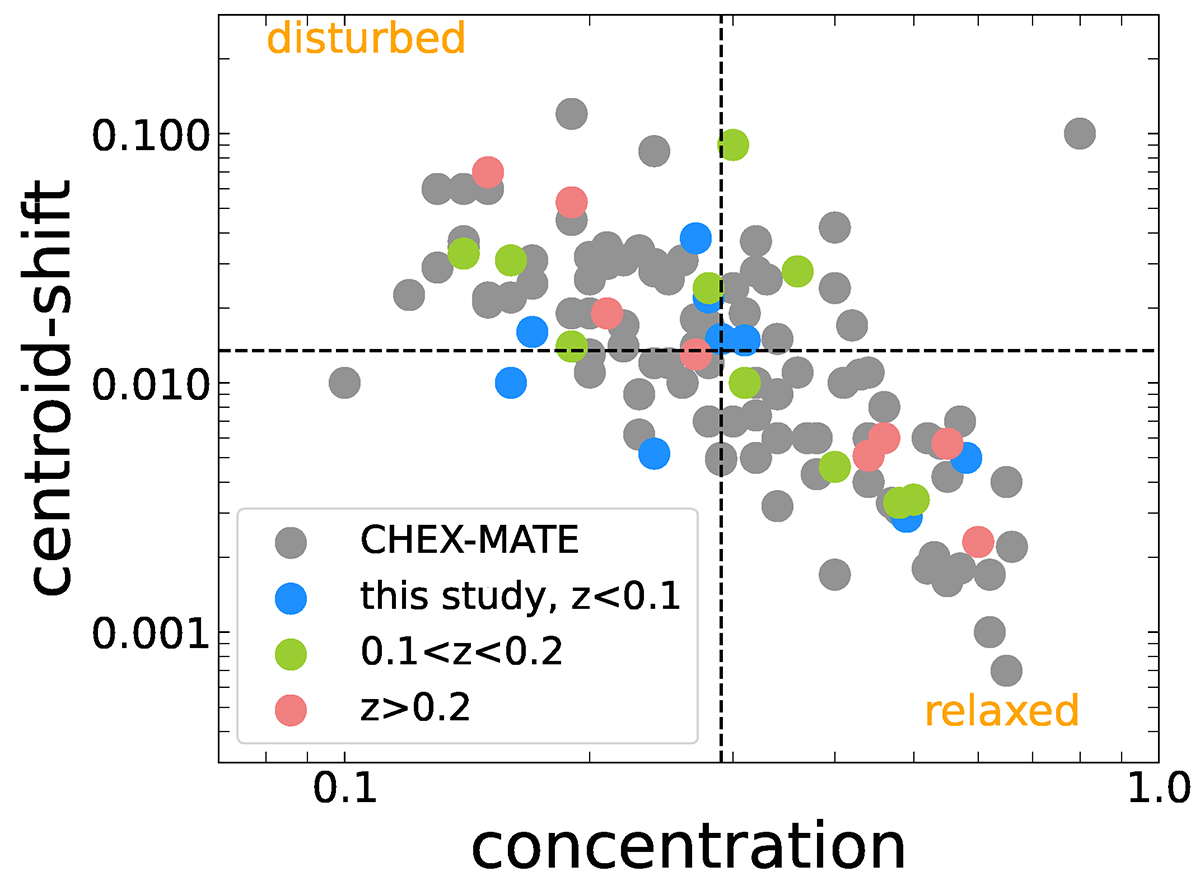
Download original image
Distribution of the clusters in our sample in the concentration-centroid-shift (i.e., c − w) space. The values are taken from Campitiello et al. (2022). The dashed lines indicate the median values. The most relaxed clusters are in the bottom-right corner while the most disturbed in the upper-left corner.
Current usage metrics show cumulative count of Article Views (full-text article views including HTML views, PDF and ePub downloads, according to the available data) and Abstracts Views on Vision4Press platform.
Data correspond to usage on the plateform after 2015. The current usage metrics is available 48-96 hours after online publication and is updated daily on week days.
Initial download of the metrics may take a while.