Open Access
Fig. 8
Download original image
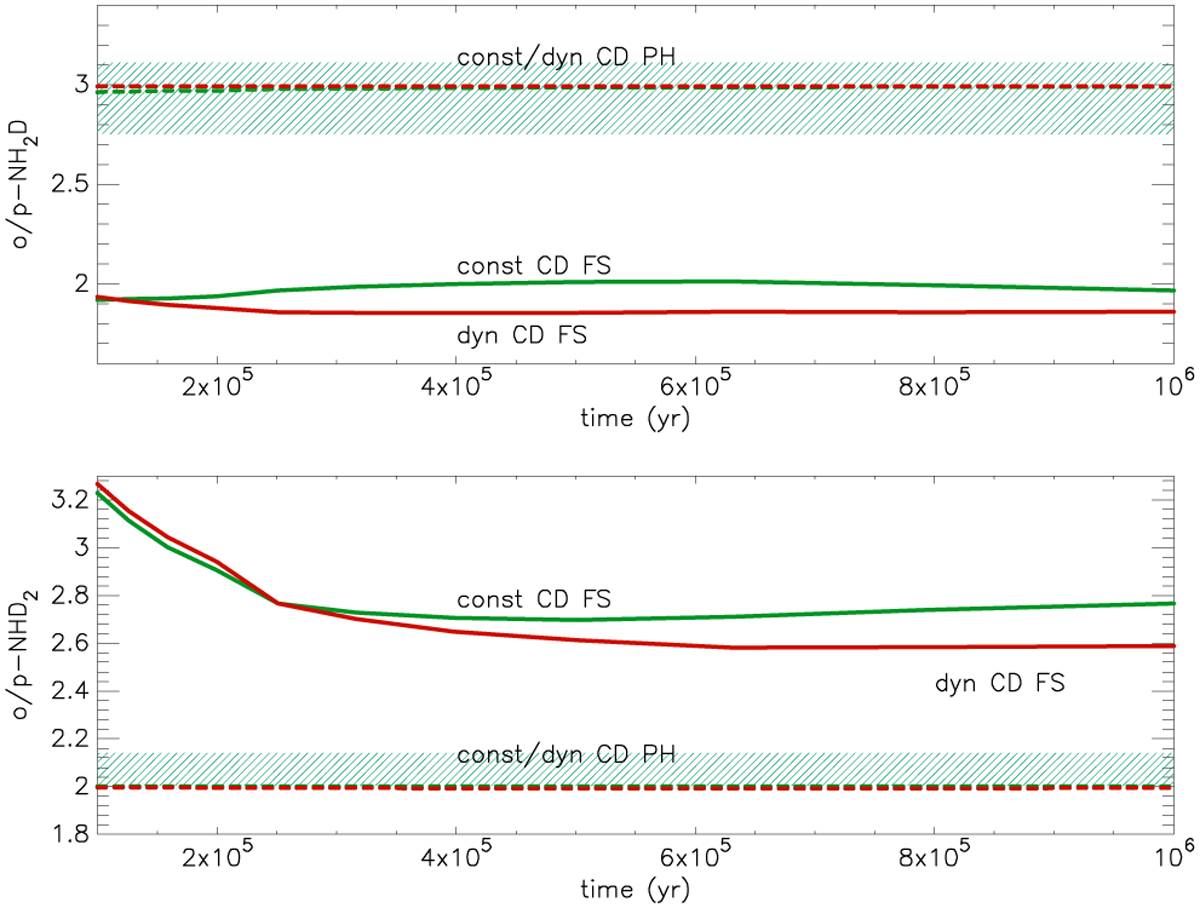
Evolution of the average o/p-NH2D and o/p-NHD2 ratios according to our chemistry model. The labelling is the same as in Fig. 5. The ranges derived from observations using the three-dimensional models for H-MM1 and Oph D with abundance profiles (b) and (c) (see Table 3) are indicated with shaded areas.
Current usage metrics show cumulative count of Article Views (full-text article views including HTML views, PDF and ePub downloads, according to the available data) and Abstracts Views on Vision4Press platform.
Data correspond to usage on the plateform after 2015. The current usage metrics is available 48-96 hours after online publication and is updated daily on week days.
Initial download of the metrics may take a while.