Fig. 4
Download original image
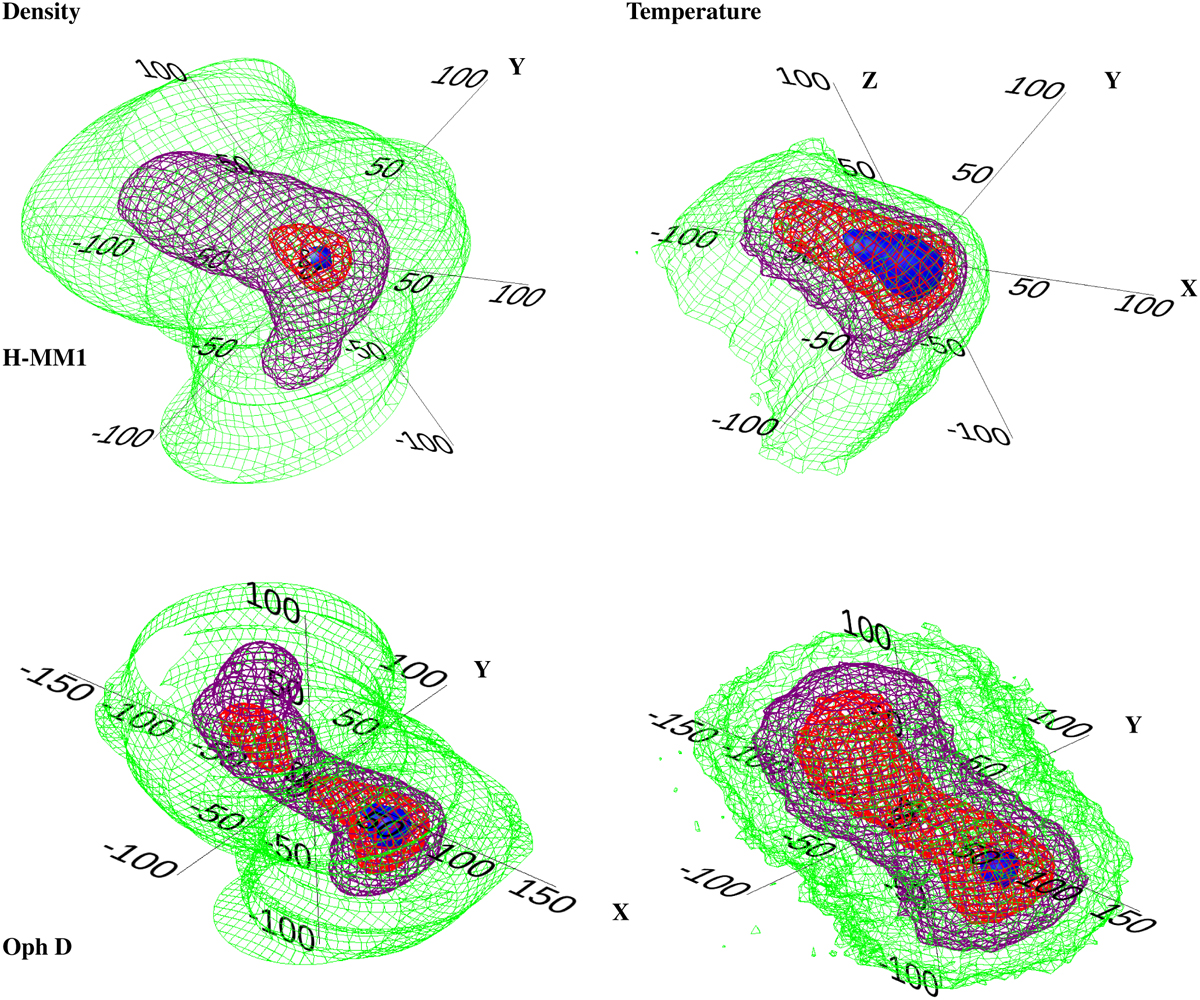
Density and dust temperature models for H-MM1 and Oph D. Top: H-MM1 The isodensity surfaces (left) are 104 cm−3 (green), 105 cm−3 (purple), 5 × 105 cm−3 (red), and 106 cm−3 (blue). The isotemperature Tdust surfaces (right) are 14 K (green), 12 K, (purple), 11 K (red), and 10 K (blue). Bottom: OphD The isodensity surfaces (left) are 104 cm−3 (green), 105 cm−3 (purple), 2 × 105 cm−3 (red), and 4 × 105 cm−3 (blue). The isotemperature Tdust surfaces (right) are 11 K (green), 10 K (purple), 9 K (red), and 8 K (blue). The positive X-axis points to the observer, and the Y-axis points to the equatorial west. The scale is in arcseconds. In both cores, the gas kinetic temperature, Tkin, is assumed to be equal to Tdust in the inner parts, and settle to 11 K in the outer parts.
Current usage metrics show cumulative count of Article Views (full-text article views including HTML views, PDF and ePub downloads, according to the available data) and Abstracts Views on Vision4Press platform.
Data correspond to usage on the plateform after 2015. The current usage metrics is available 48-96 hours after online publication and is updated daily on week days.
Initial download of the metrics may take a while.