Fig. C.1
Download original image
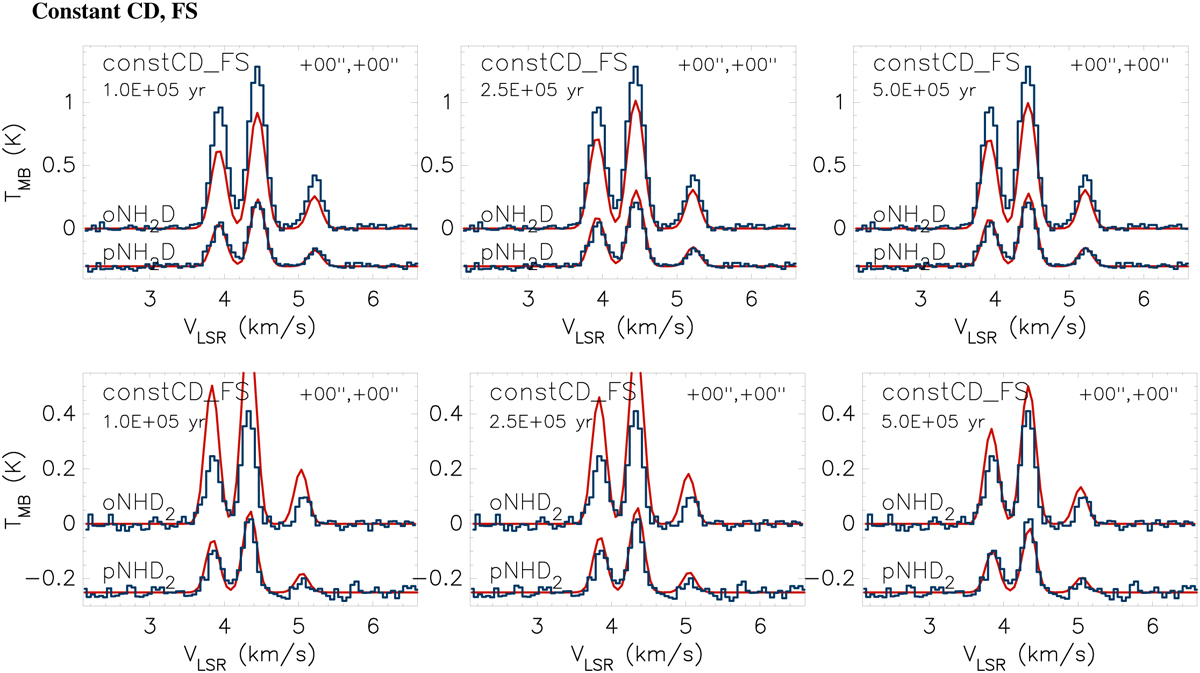
Simulated NH2D and NHD2 spectra towards the centre of the three-dimensional model for H-MM1 with abundance distributions interpolated from the chemistry model assuming constant CD and full scrambling (FS, red lines). The spectra are convolved with the APEx beam. Spectra observed with APEx towards the centre of H-MM1 are shown with blue lines.
Current usage metrics show cumulative count of Article Views (full-text article views including HTML views, PDF and ePub downloads, according to the available data) and Abstracts Views on Vision4Press platform.
Data correspond to usage on the plateform after 2015. The current usage metrics is available 48-96 hours after online publication and is updated daily on week days.
Initial download of the metrics may take a while.