Fig. 1
Download original image
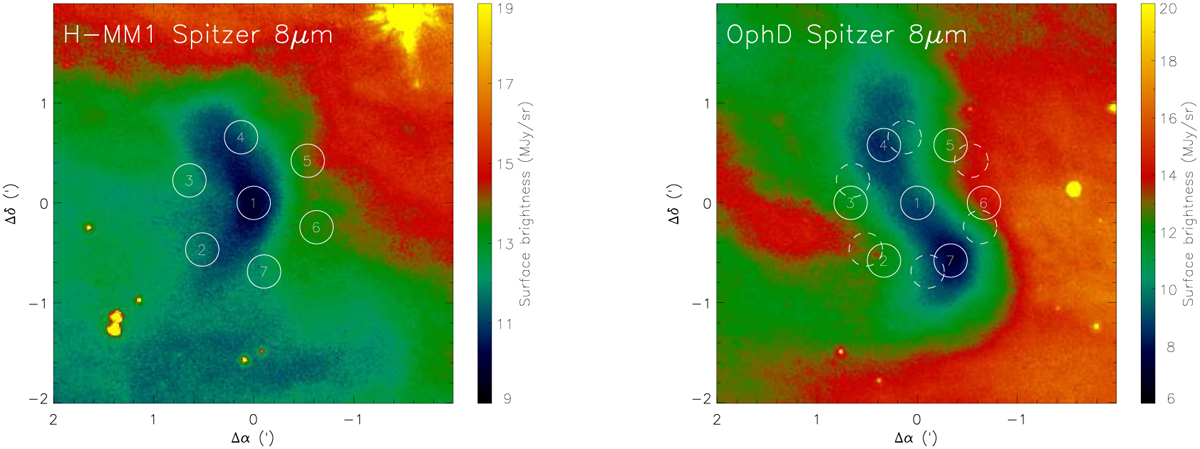
Footprint of the APEX/LAsMA array on the 8 μm surface brightness images of H-MM1 (left) and Oph D (right) observed by the Spitzer satellite. The dashed and solid circles on the right represent two orientations of the array in observations towards Oph D. The positions of the central pixels are RA 16h27m58s.5, Dec – 24°33′40″ (J2000.0) for H-MM1, and RA 16h28m30s.2, Dec – 24°18′42″ for Oph D.
Current usage metrics show cumulative count of Article Views (full-text article views including HTML views, PDF and ePub downloads, according to the available data) and Abstracts Views on Vision4Press platform.
Data correspond to usage on the plateform after 2015. The current usage metrics is available 48-96 hours after online publication and is updated daily on week days.
Initial download of the metrics may take a while.