Fig. 8
Download original image
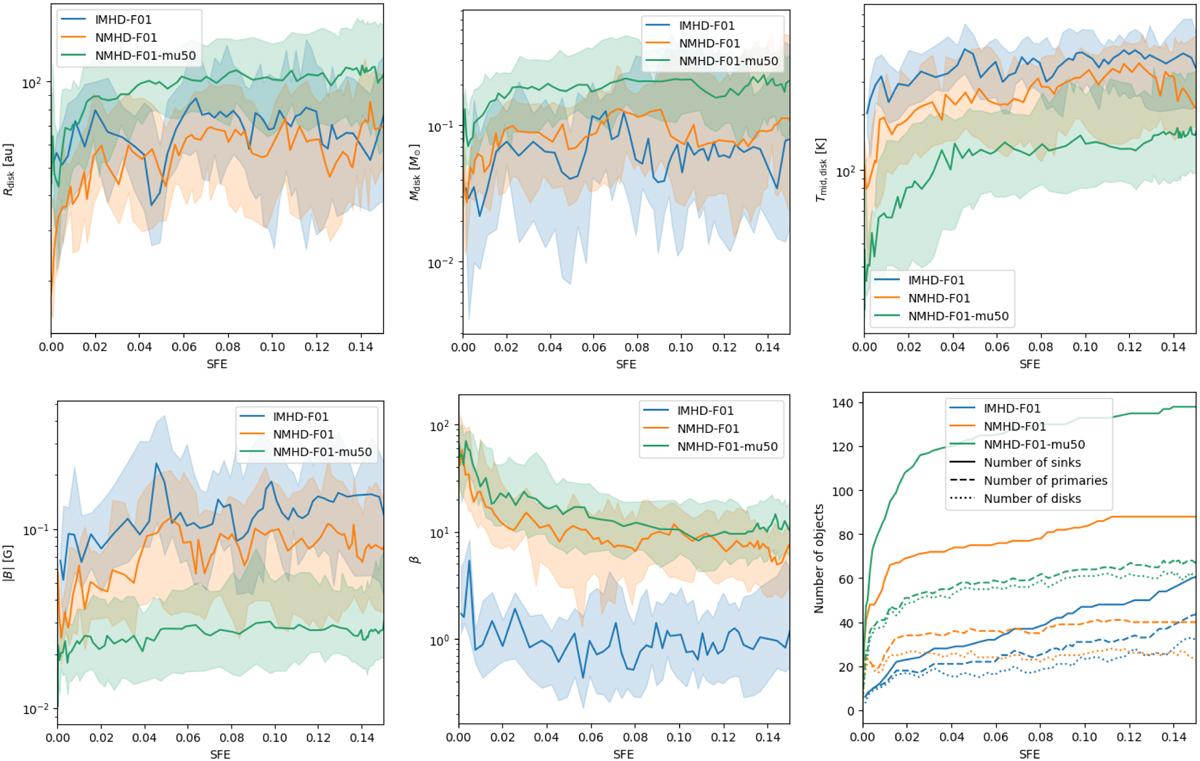
Evolution of the disk properties for NMHD-F01, IMHD-F01, and NMHD-F01-MU50 against the SFE. The lines correspond to the median of the distribution and the colored regions correspond to the area between the first and third quartile of the distribution. From left to right and top to bottom: radius, mass, mid-planet temperature, magnetic field strength, plasma beta, and number of objects.
Current usage metrics show cumulative count of Article Views (full-text article views including HTML views, PDF and ePub downloads, according to the available data) and Abstracts Views on Vision4Press platform.
Data correspond to usage on the plateform after 2015. The current usage metrics is available 48-96 hours after online publication and is updated daily on week days.
Initial download of the metrics may take a while.