Open Access
Fig. 1
Download original image
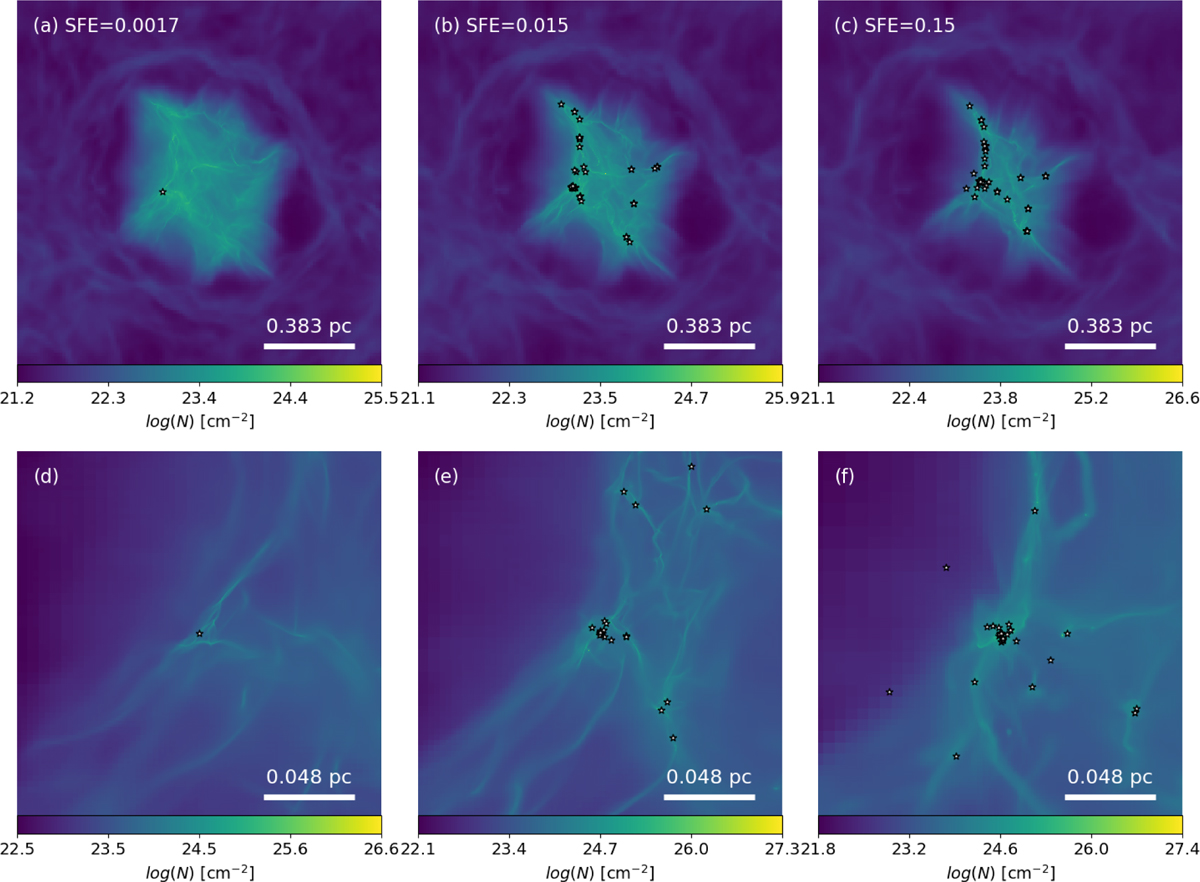
Evolution of the clump of run NMHD-F01 at various times (SFE = 0.0017, 0.015 and 0.15). Panels a–c: full column density maps in the (x–y) plane. Panels d–f: same maps but centered around sink 1 (located in the hub) and with an extent of 12.5% of the box scale. Sinks are represented by star symbols.
Current usage metrics show cumulative count of Article Views (full-text article views including HTML views, PDF and ePub downloads, according to the available data) and Abstracts Views on Vision4Press platform.
Data correspond to usage on the plateform after 2015. The current usage metrics is available 48-96 hours after online publication and is updated daily on week days.
Initial download of the metrics may take a while.