Fig. 6.
Download original image
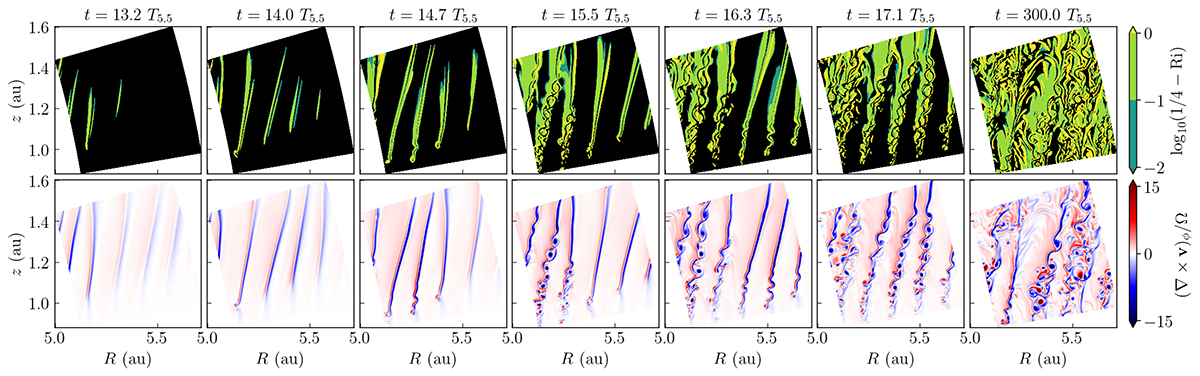
Onset of the KHI in run dg3c4_2048 in a region at the disk upper layers, where the instability first occurs. Top: snapshots at different times (in units of the orbital period at 5.5 au) showing the deviation of the radial Richardson number (Eq. (1)) from its critical value of 1/4 required to trigger the KHI. Black regions correspond to Ri > 1/4. Bottom: same snapshot showing the azimuthal vorticity, highlighting the formation of eddies. The rightmost panels show the same quantities > 200 orbits after VSI saturation.
Current usage metrics show cumulative count of Article Views (full-text article views including HTML views, PDF and ePub downloads, according to the available data) and Abstracts Views on Vision4Press platform.
Data correspond to usage on the plateform after 2015. The current usage metrics is available 48-96 hours after online publication and is updated daily on week days.
Initial download of the metrics may take a while.