Fig. 15.
Download original image
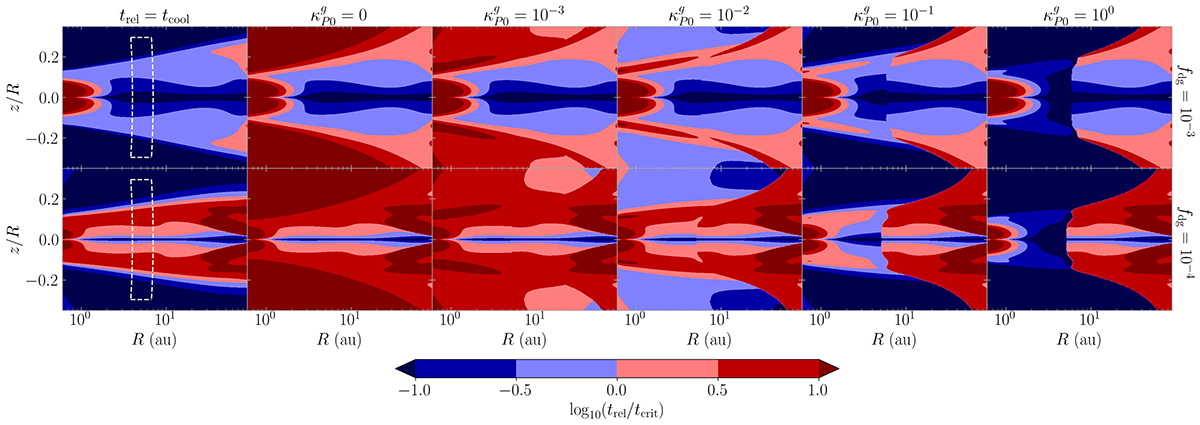
VSI-stability maps showing the ratio of the relaxation time to the critical cooling time defined in the local stability criterion (Eq. (7)). From left to right, trel/tcrit values are computed assuming only radiative cooling (trel = tcool), including dust collisions (![]() ), and including as well molecular emission with
), and including as well molecular emission with ![]() (Eq. (13)). The top and bottom row correspond to the nominal and dust-depleted cases, respectively. Also shown in the leftmost panels is the location of the domain used in our Rad-HD simulations (white dashed box). The gas opacities reported in Freedman et al. (2008), Malygin et al. (2014, 2017) for solar abundances correspond to
(Eq. (13)). The top and bottom row correspond to the nominal and dust-depleted cases, respectively. Also shown in the leftmost panels is the location of the domain used in our Rad-HD simulations (white dashed box). The gas opacities reported in Freedman et al. (2008), Malygin et al. (2014, 2017) for solar abundances correspond to ![]() .
.
Current usage metrics show cumulative count of Article Views (full-text article views including HTML views, PDF and ePub downloads, according to the available data) and Abstracts Views on Vision4Press platform.
Data correspond to usage on the plateform after 2015. The current usage metrics is available 48-96 hours after online publication and is updated daily on week days.
Initial download of the metrics may take a while.